Strategy Introduction
This section outlines a long-only trend-following strategy designed for the 4-hour timeframe. The system uses core components of the Ichimoku Cloud to identify the emergence of bullish market trends and initiate positions once multiple trend-confirmation signals align.
Rather than reacting to every short-term price movement, the strategy waits for a confluence of technical conditions indicating that upward momentum is developing. These conditions combine several elements of the Ichimoku framework with additional trend filters to ensure that trades are only initiated when the broader market structure supports continuation to the upside.
Risk management is a central component of the strategy. Position size is determined dynamically based on the distance to the stop-loss, allowing each trade to maintain a consistent risk exposure regardless of market volatility. The stop-loss itself adapts to changing market conditions, helping to limit downside risk while allowing profitable trends the opportunity to develop.
Due to its trend-following nature, the strategy may experience periods of consecutive small losses when markets move sideways or fail to sustain momentum. However, these losses are intended to be offset by occasional larger winning trades that capture sustained trending moves.
All signals, position sizing, and risk parameters are fully systematic and governed by a predefined rule set, ensuring that the strategy operates mechanically and without discretionary intervention.
Automatic Indicator Labels and Tables
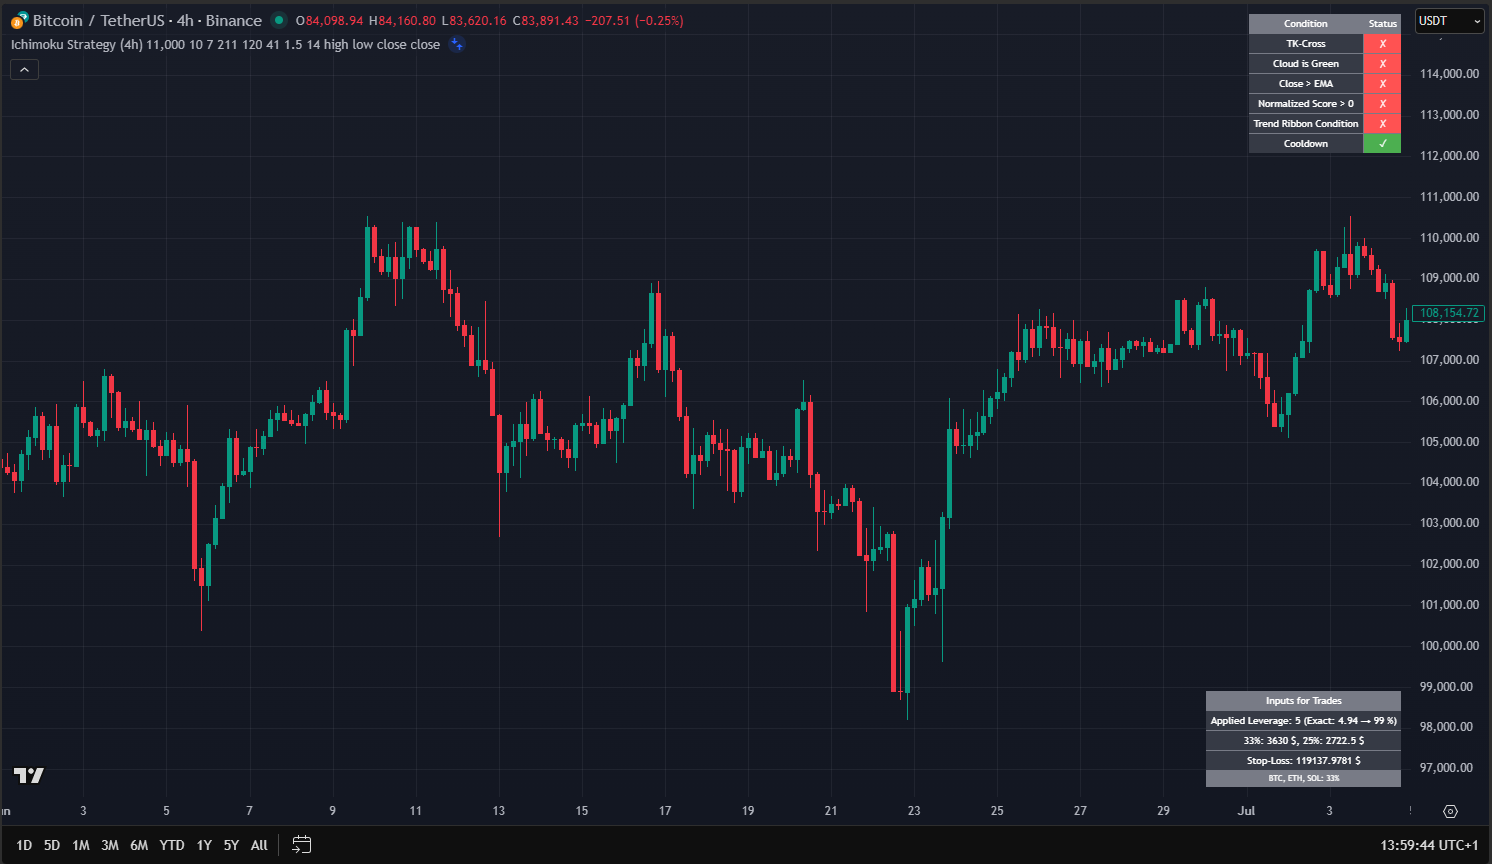
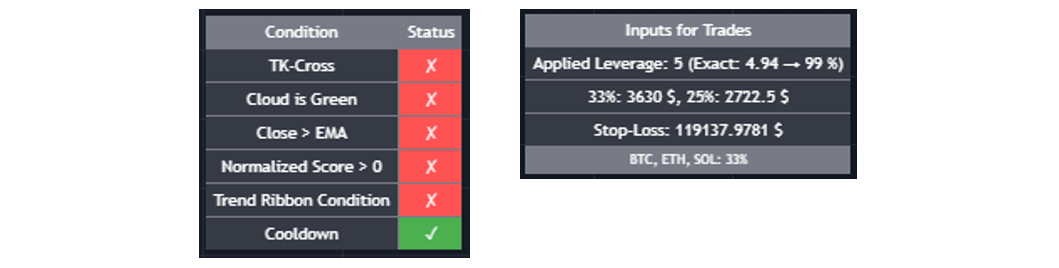
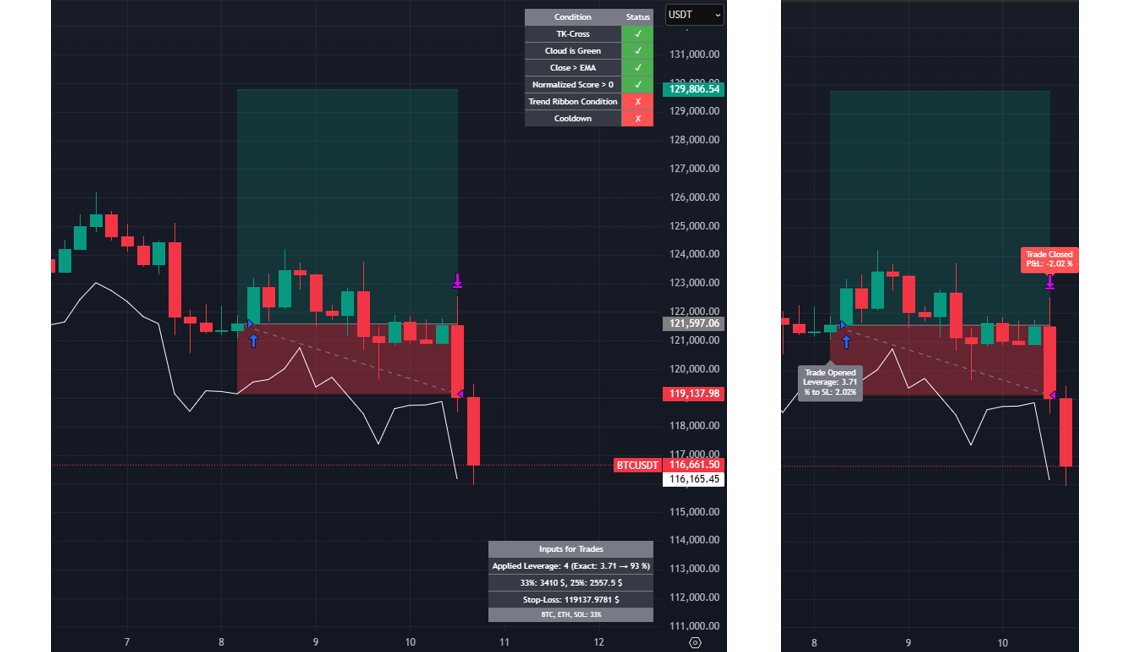
The picture below shows the two indicator tables: „Indicator Condition Status Table“ and „Trade Input Table“. Both tables are generated and updated automatically. A new trading signal is only triggered, if all conditions of the „Indicator Condition Status Table“ are green. Once the entry condition is met, the parameters in the „Trade Input Table“ are updated. These can be used directly as inputs for the crypto trading platform. Hence, no manual calculations are necessary.
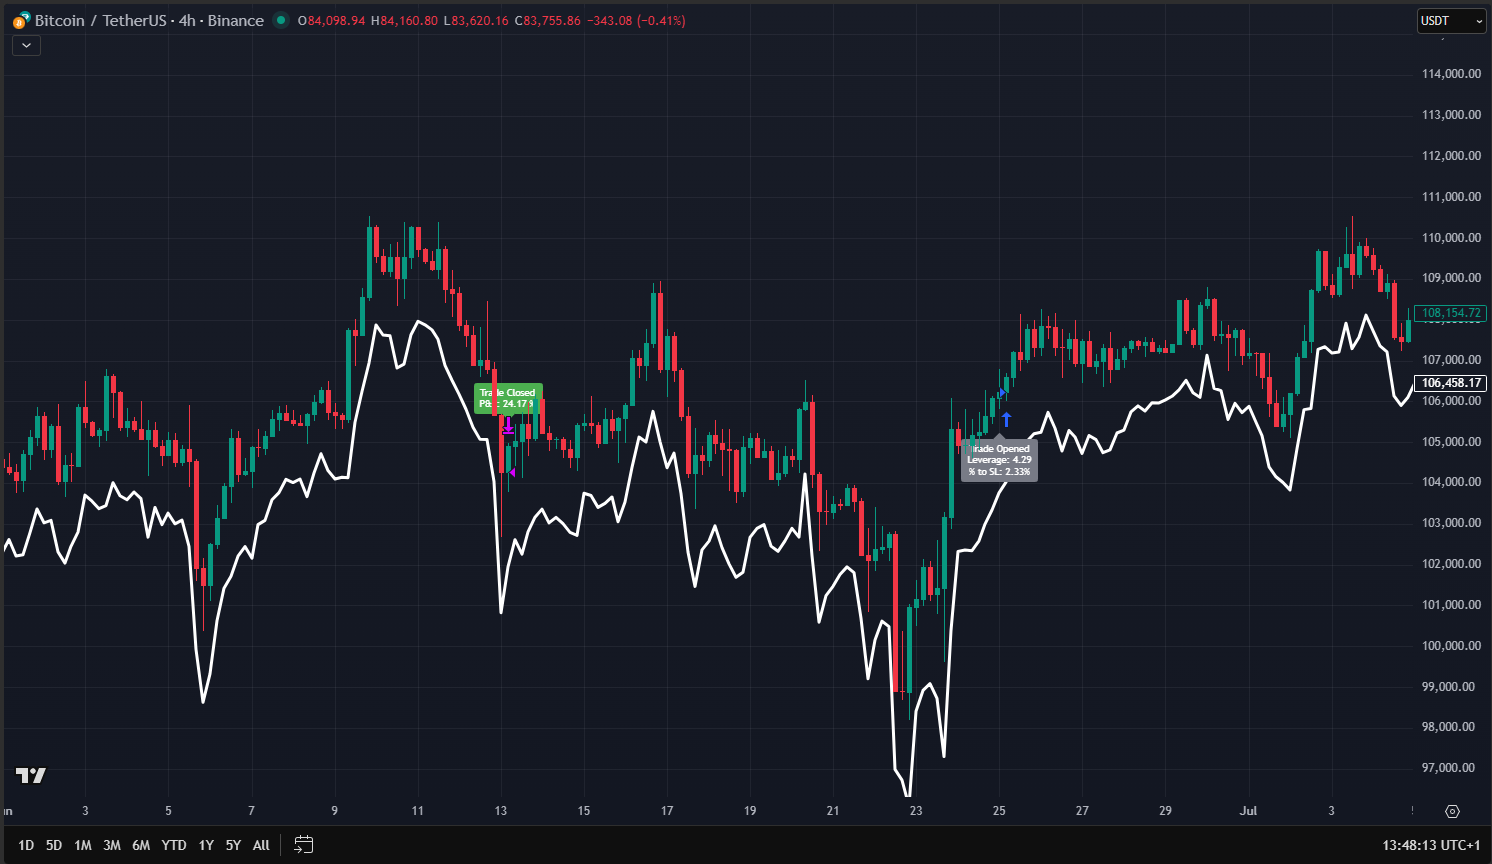
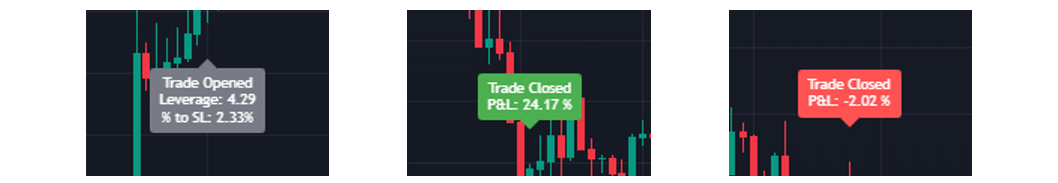
The strategy also indicates entries and exits via additional labels which are mainly used for backtesting, position indication and verification.
The position size and leverage calculator works as follows as explained with an example. The inputs are defined as shown below.
- Account_Balance = $10,000
- %_Per_Position = 33%
- %_Max_Loss_Per_Trade = 7.5%
- Entry_Price = $121,597.06
- ATR_StopLoss = $119,137.98
In a first step, the %-To-Stop-Loss is calculated. This is the relative distance between the ATR stoploss price and the entry price.

Next, the exact leverage and rounded leverage are calculated.


Now the percentage of the portfolio used based on the ceiled leverage is calculated. Since the ceiled leverage would end up in a larger position size, the actual amount is smaller.

Now, the actual position size used for the trade is calculated.

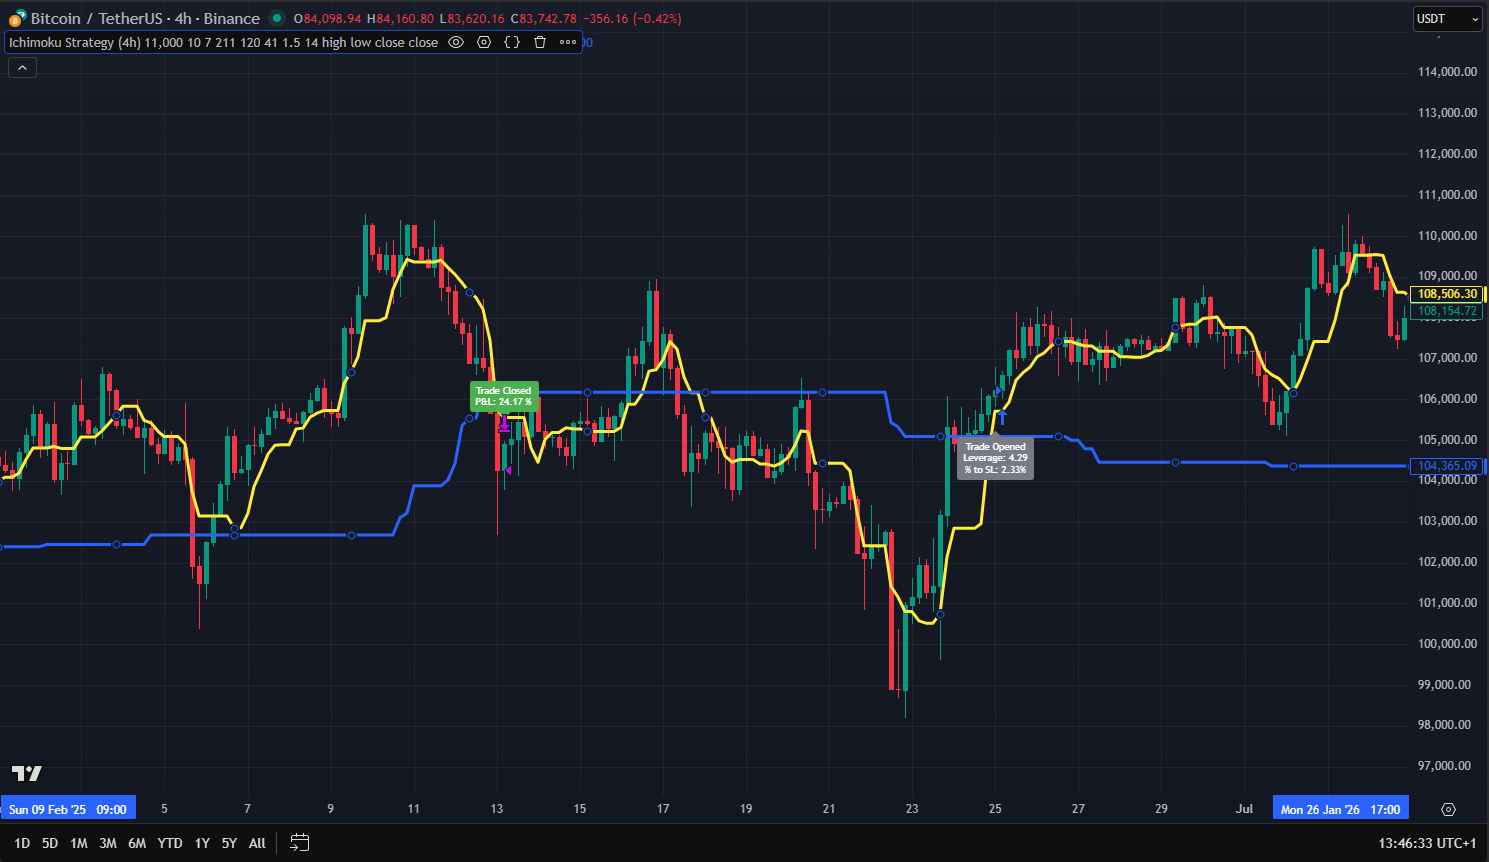
The result: A position size of $3.091.63 is used with a leverage of 4 to enter the trade. In case of a loss, this guarantees a max. loss of exact 7.5% for the position (2.5% with respect to the total account balance). All calculations are done automatically by the indicator and are displayed in the „Trade Input Table“. The real trade in this example is shown in the screenshot below.
Technical Indicators
In this section, the technical indicators are explained.
Ichimoku Cloud
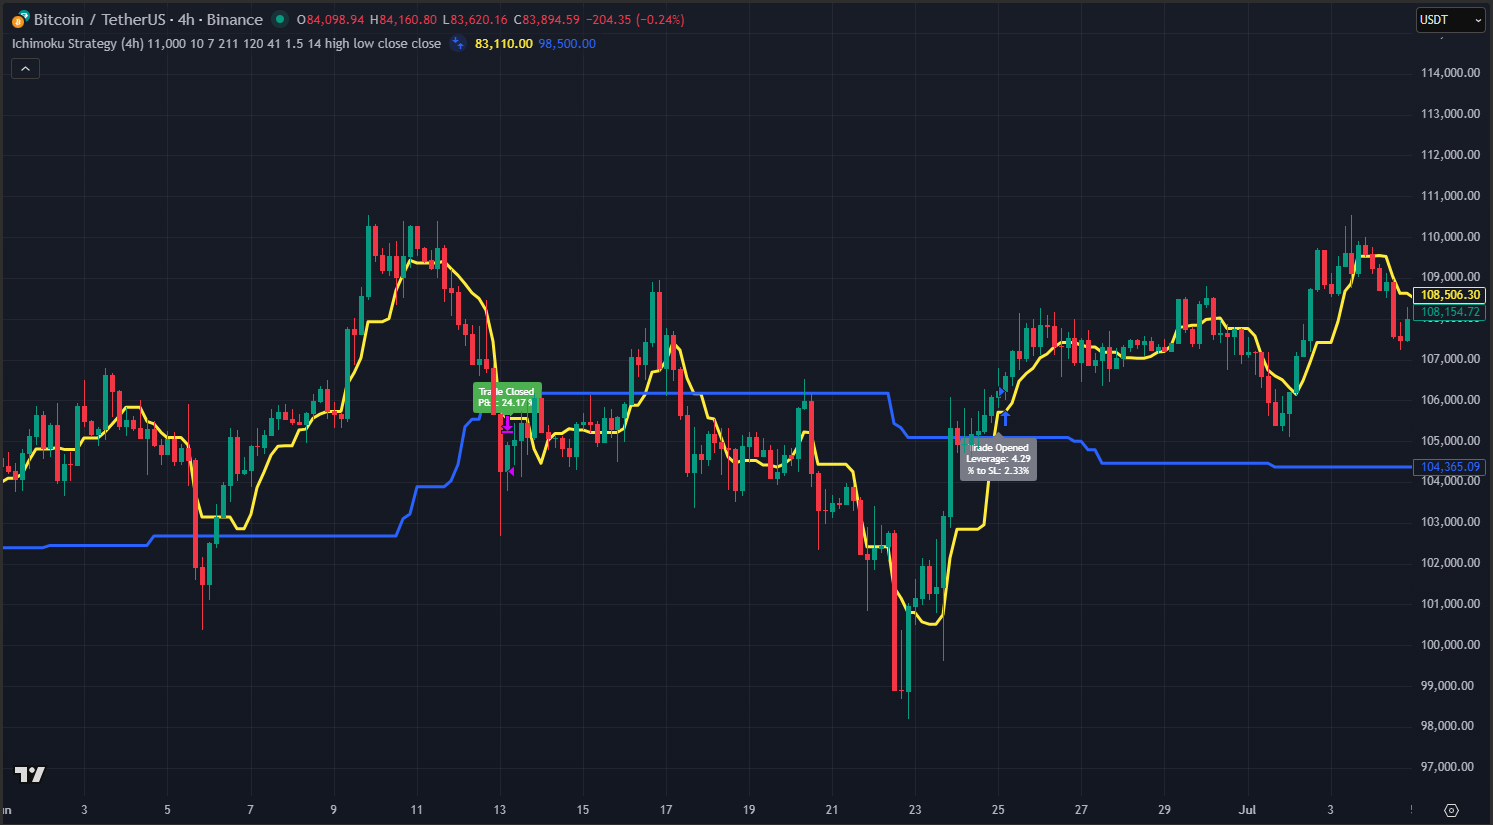
The Ichimoku Cloud (Ichimoku Kinko Hyo) is a trend-following and momentum indicator that helps traders understand trend direction, support and resistance, and potential entry signals in a single glance. It is built from several components, with the Cloud and the TK lines being the most important.
The Ichimoku Cloud is formed by two lines: Senkou Span A, which is the midpoint between the Tenkan-sen and the Kijun-sen projected forward, and Senkou Span B, which is the midpoint of the highest high and lowest low over a longer lookback period, also projected forward. When price is above the Cloud, the market is considered to be in an uptrend. When price is inside the Cloud, the market is viewed as consolidating. When price is below the Cloud, the market is considered to be in a downtrend. The thickness of the Cloud represents the strength of support or resistance. The Ichimoku Cloud is shown in the screenshot below.
The main purpose of using the Ichimoku Cloud as a long-term filter is to confirm the trend and reduce the risk of entering trades based on fakeouts.
The TK lines consist of the Tenkan-sen (Conversion Line) and the Kijun-sen (Base Line). The Tenkan-sen is calculated from the midpoint of the highest high and lowest low over a short period (usually 9 periods), and it reflects short-term market equilibrium. The Kijun-sen is calculated in the same way but over a longer period (typically 26 periods), so it represents a more stable medium-term trend level. A TK cross, which occurs when the Tenkan-sen crosses the Kijun-sen, can signal a potential trend shift. A bullish cross happens when the Tenkan-sen moves above the Kijun-sen, and a bearish cross occurs when it moves below. The signal is generally considered stronger when it occurs above the Cloud in bullish cases or below the Cloud in bearish cases. The TK lines are shown in the screenshot below.
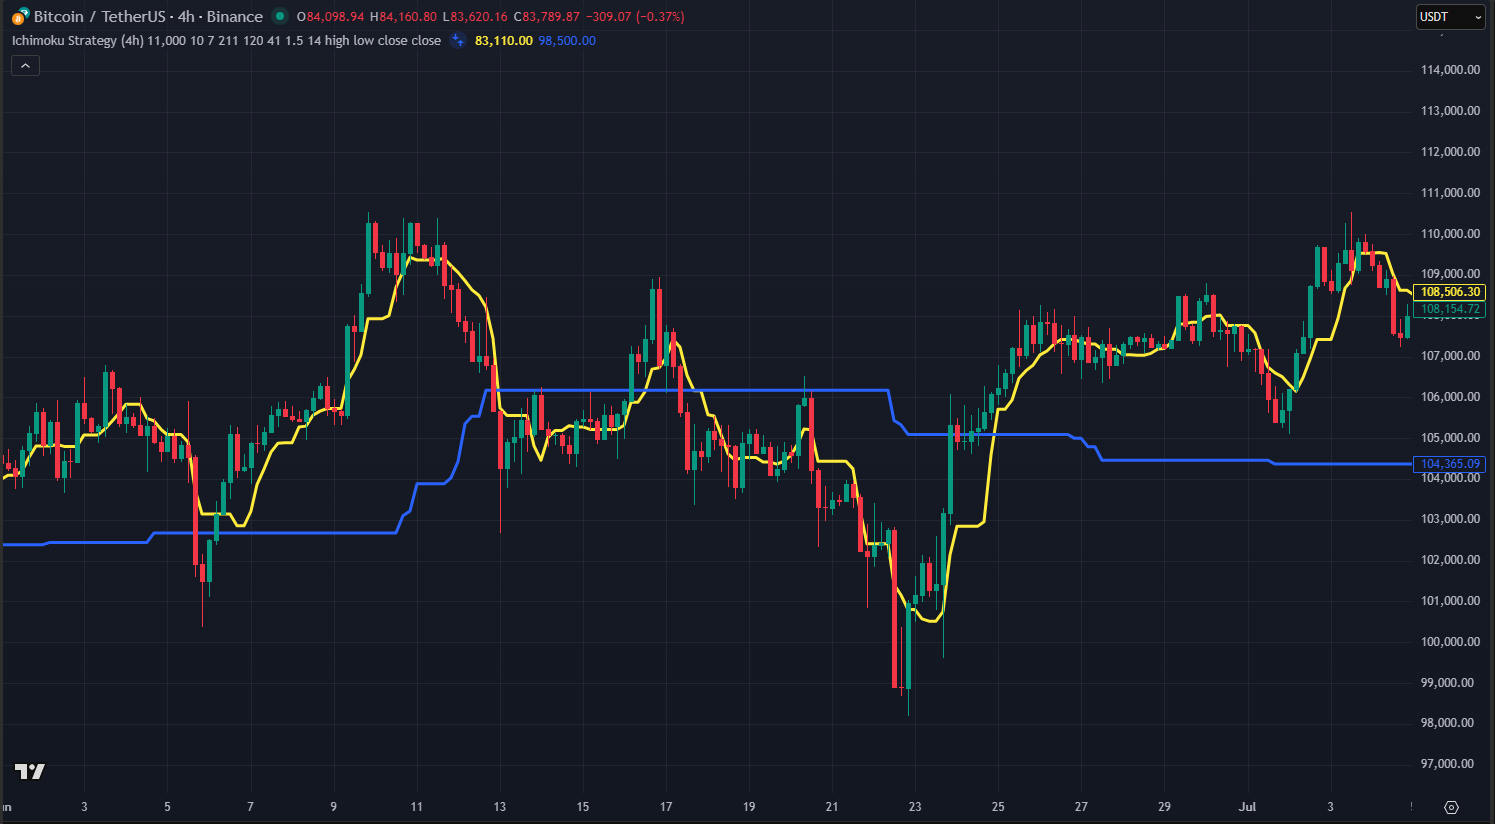
The main purpose of the TK lines in this trading strategy is to trigger entries and exits when a TK cross occurs.
Exponential Moving Average
An exponential moving average with a length of approximately 200 is used as an additional general trend indication. A screenshot of the exponential moving average is shown below.
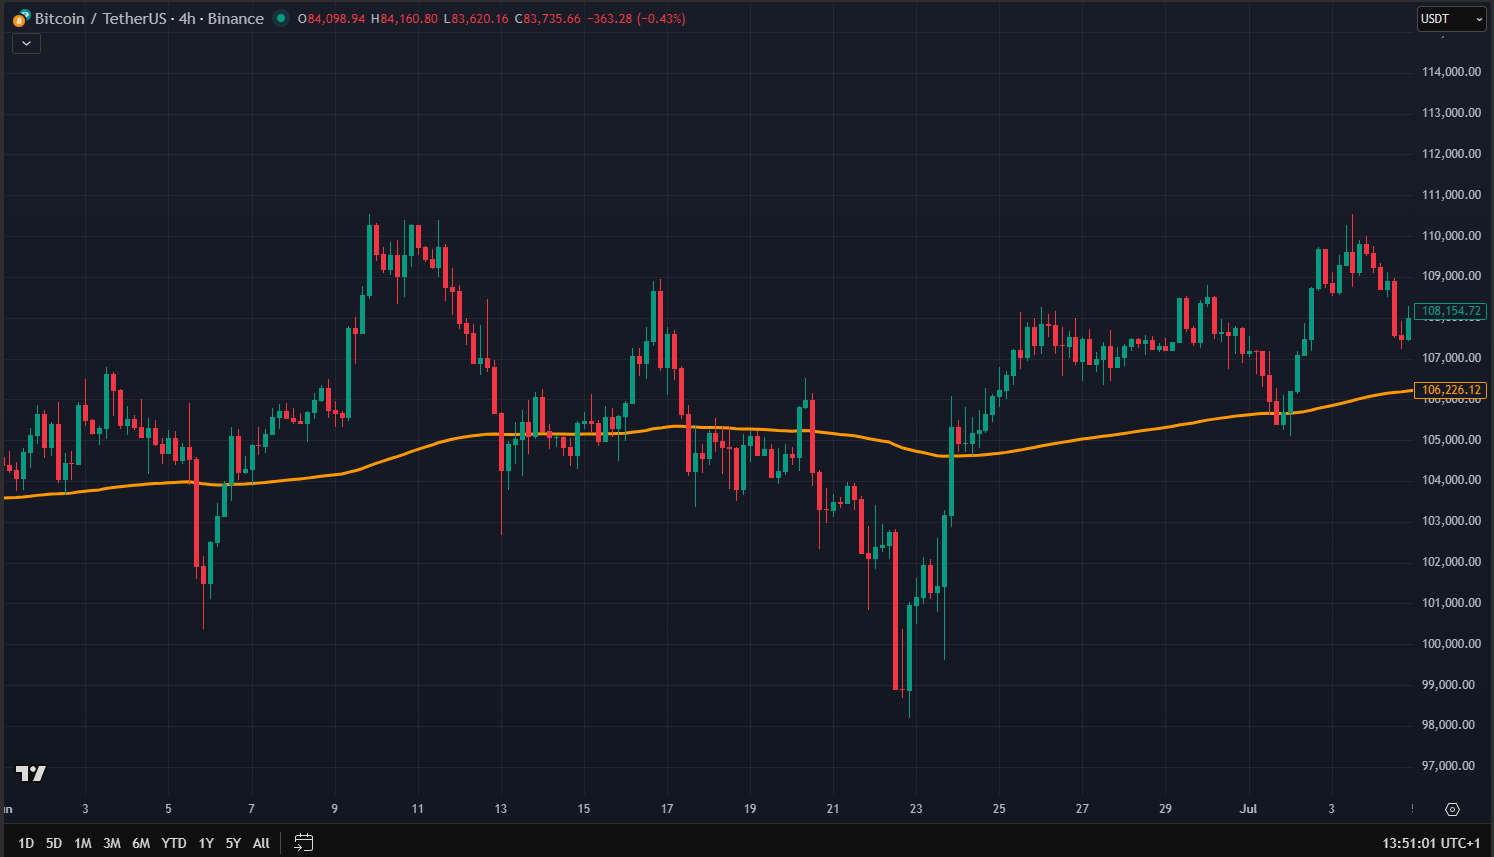
The main purpose of the EMA is to serve as a long-term trend indication filter.
Ichimoku Score
The Ichimoku Score Indicator combines all major Ichimoku signals into one single numeric value. Instead of looking at each component separately (TK cross, cloud position, Chikou, Kumo breakout, etc.), it assigns each of these conditions a bullish or bearish score, weights them, and adds them together. The result is a normalized score from -100 to +100 that shows how strongly bullish or bearish the overall Ichimoku system is at the moment. An example of the Ichimoku Score Indicator is shown in the screenshot below.
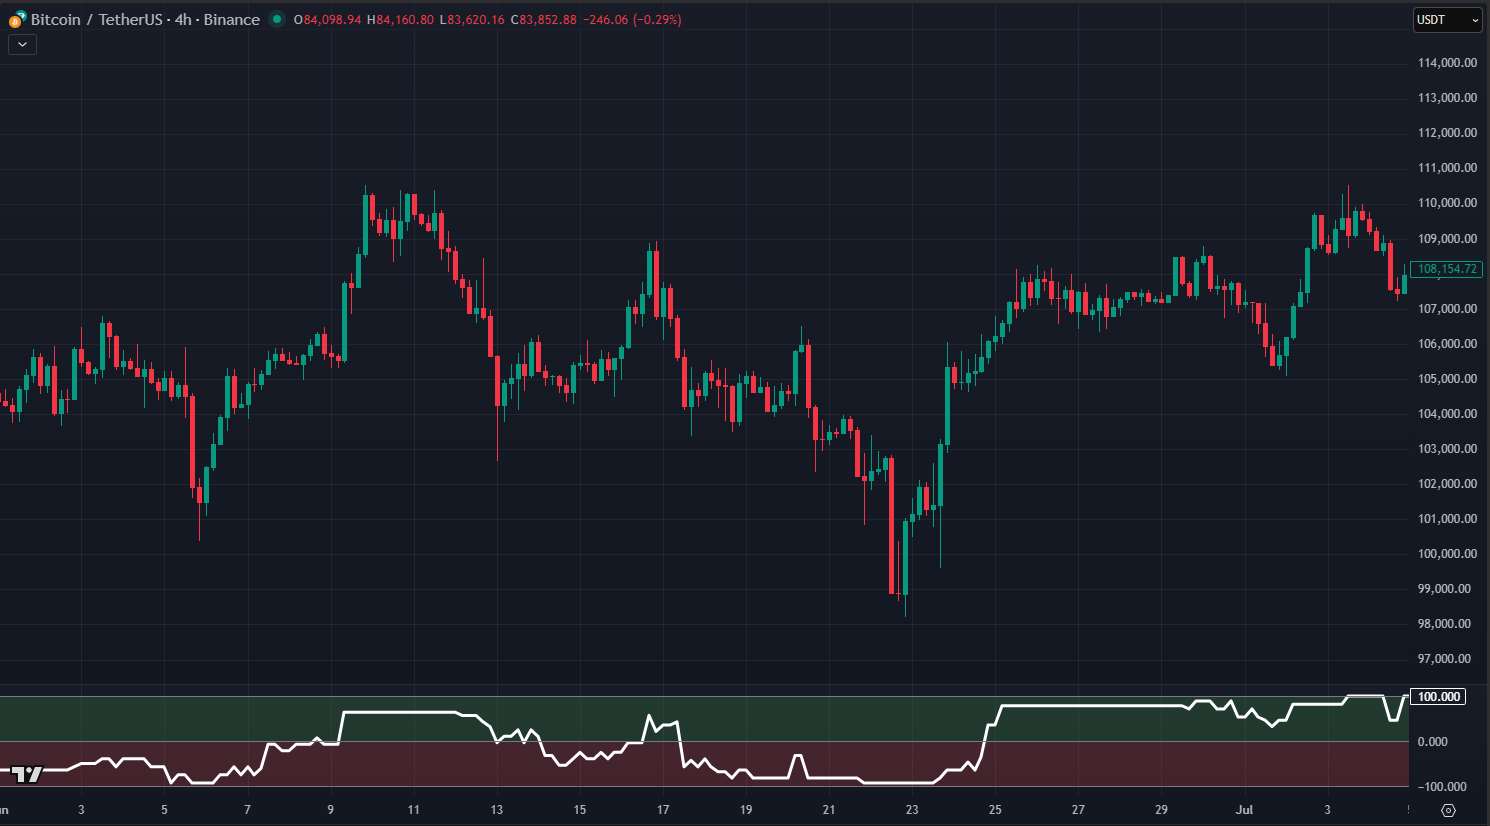
The main purpose of the Ichimoku Score Indicator is to serve as a short-term filter. It helps avoid entering trades during unfavorable conditions, even when the overall trend is still acceptable.
Hull Moving Average Trend Ribbon Indicator
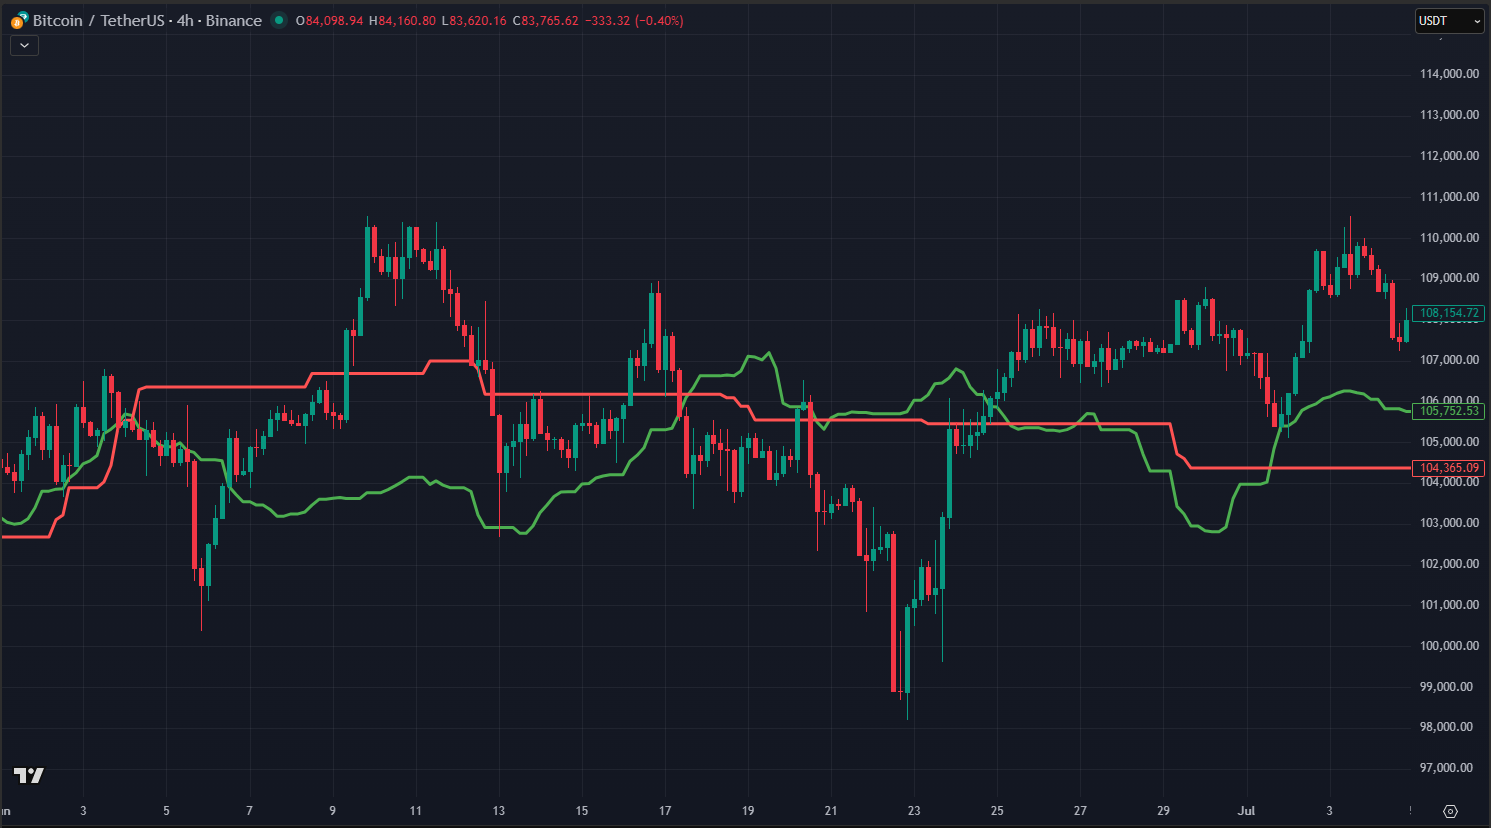
The Trend Ribbon Indicator is a simple trend-direction tool that compares two smoothed moving averages. When the shorter moving average is above the longer one, the ribbon turns green to signal bullish momentum. When the shorter average moves below the longer one, the ribbon turns red to indicate bearish momentum. By coloring and filling the space between the two lines, the indicator provides a clear, visual representation of the current trend strength and direction. A screenshot of the Trend Ribbon Indicator is shown below.
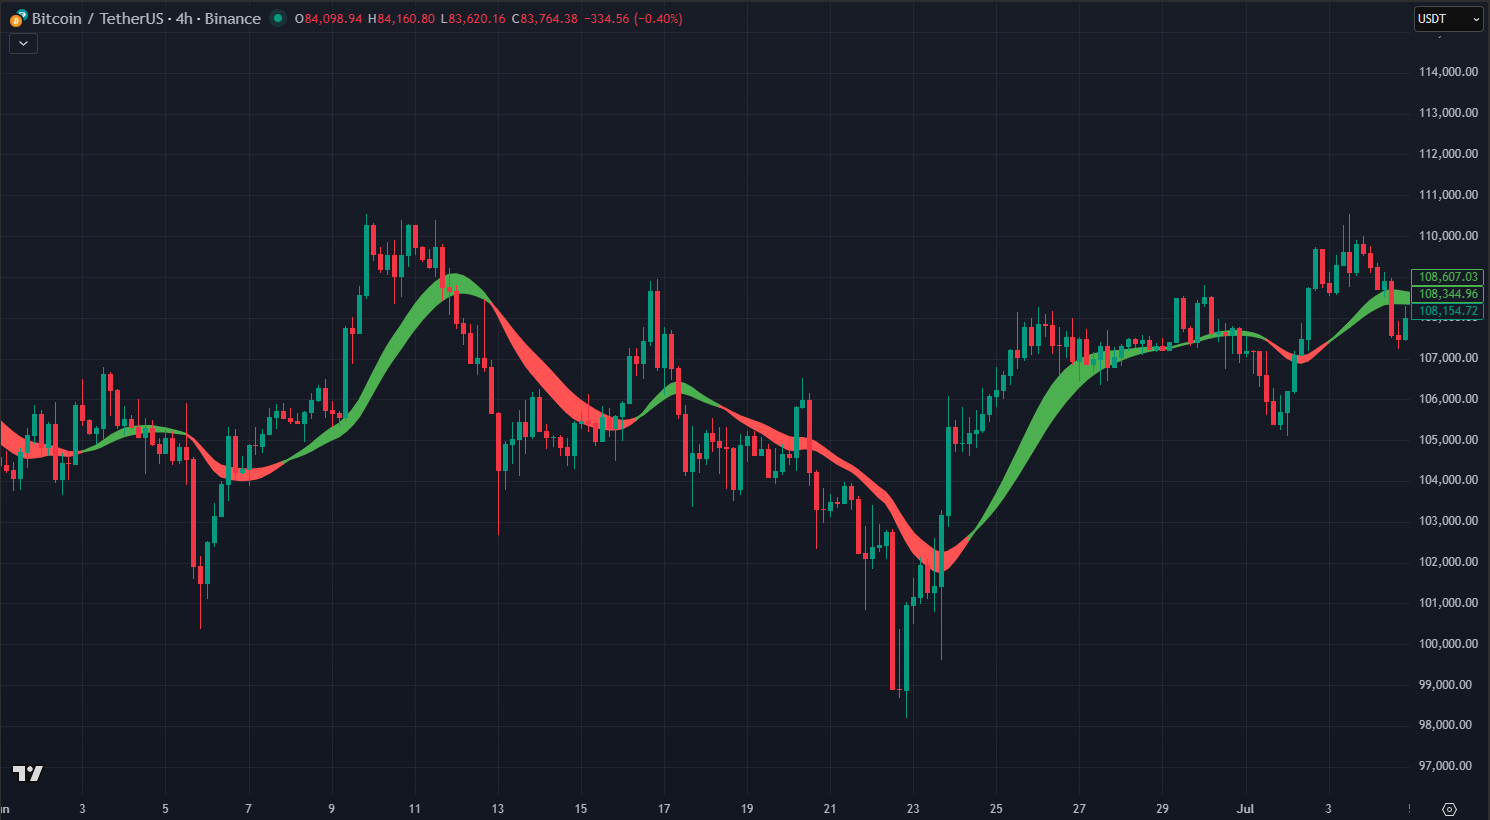
The main purpose of the Trend Ribbon Indicator is to serve as a short-term filter. It helps avoid entering trades during unfavorable conditions, even when the overall trend is still acceptable. It works in conjunction with the Ichimoku Score Indicator.
Entry and Exit Conditions
In this section, the entry and exit conditions are explained.
Entry Condition – TK-Cross
The strategy uses an upward TK cross as the sole entry trigger. When the Tenkan-sen crosses above the Kijun-sen, it signals strengthening short-term momentum and initiates a new position. The TK cross acts as the confirmation needed to enter the trade. A position is only entered if all other conditions are already met, or once they become met after the TK cross.
It is important to emphasize that an upward trend will always be caught. The strategy effectively ‘tries’ as many times as necessary to capture a new upward trend until it succeeds. To do so, the required conditions may line up in either direction: The TK cross may occur after all other conditions are already in place, or the TK cross may happen first, followed by each remaining condition appearing one by one.
Exit Conditions – TK-Cross & ATR Stop-Loss
In this section, the exit conditions „TK-cross“ and „ATR Stop-Loss“ are explained.
TK-Cross Exit Condition
The strategy uses a downward TK cross as an exit signal. When the Tenkan-sen crosses below the Kijun-sen, it indicates a potential shift in momentum against the position, prompting the strategy to close the trade. Usually, this exit condition is relatively loose and allows trades to continue running during periods of sustained upward momentum.
ATR Stop-Loss Exit Condition
In the trading strategy, the ATR is used as a stop-loss by placing it a certain multiple of the market’s recent volatility away from the entry price. This creates a dynamic stop that adapts to changing market conditions, widening during high volatility and tightening during calmer periods. The %-to-stop-loss value is calculated based on the ATR value at the time the trade is entered. This mechanism ensures that the position is exited if the market turns downward.