Summary Statistics
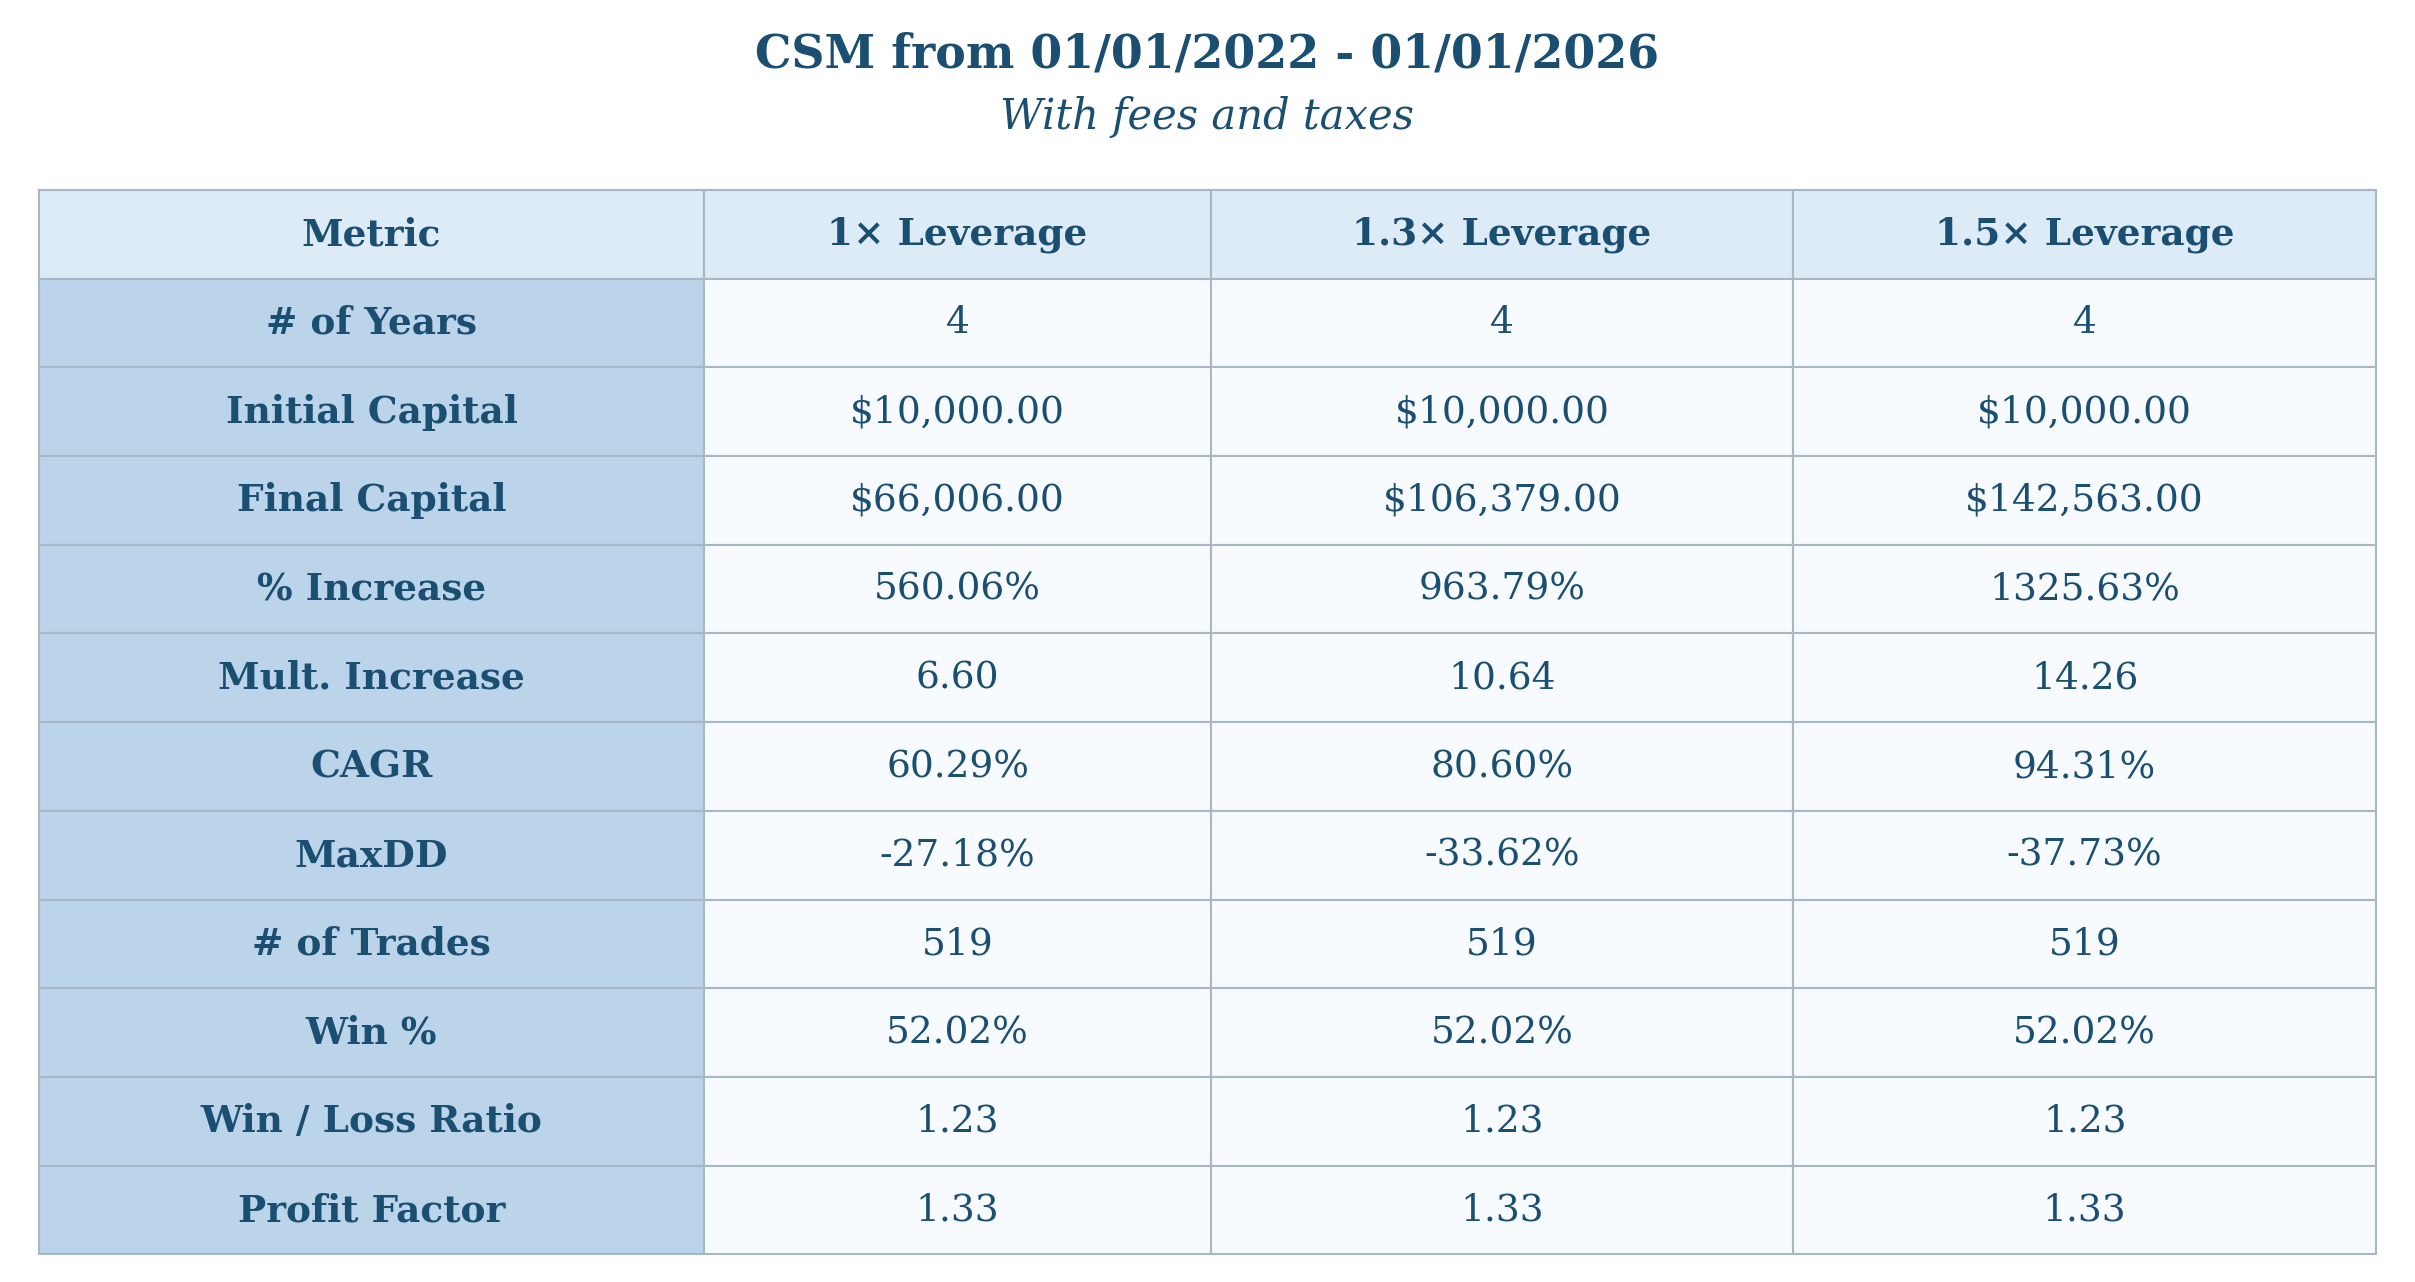
The summary statistics for the Cross-Sectional Momentum Strategy are shown in the following table. The results use the following settings and assumptions:
- Backtest duration: 01/01/2022 – 01/01/2026
- Tax assumption: 45% annually (at the end of each year and on gains only)
- Leverage settings: 1.0x, 1.3x and 1.5x leverage
- Initial Capital of $10,000
1.0x Leverage – Equity and Drawdown Curve
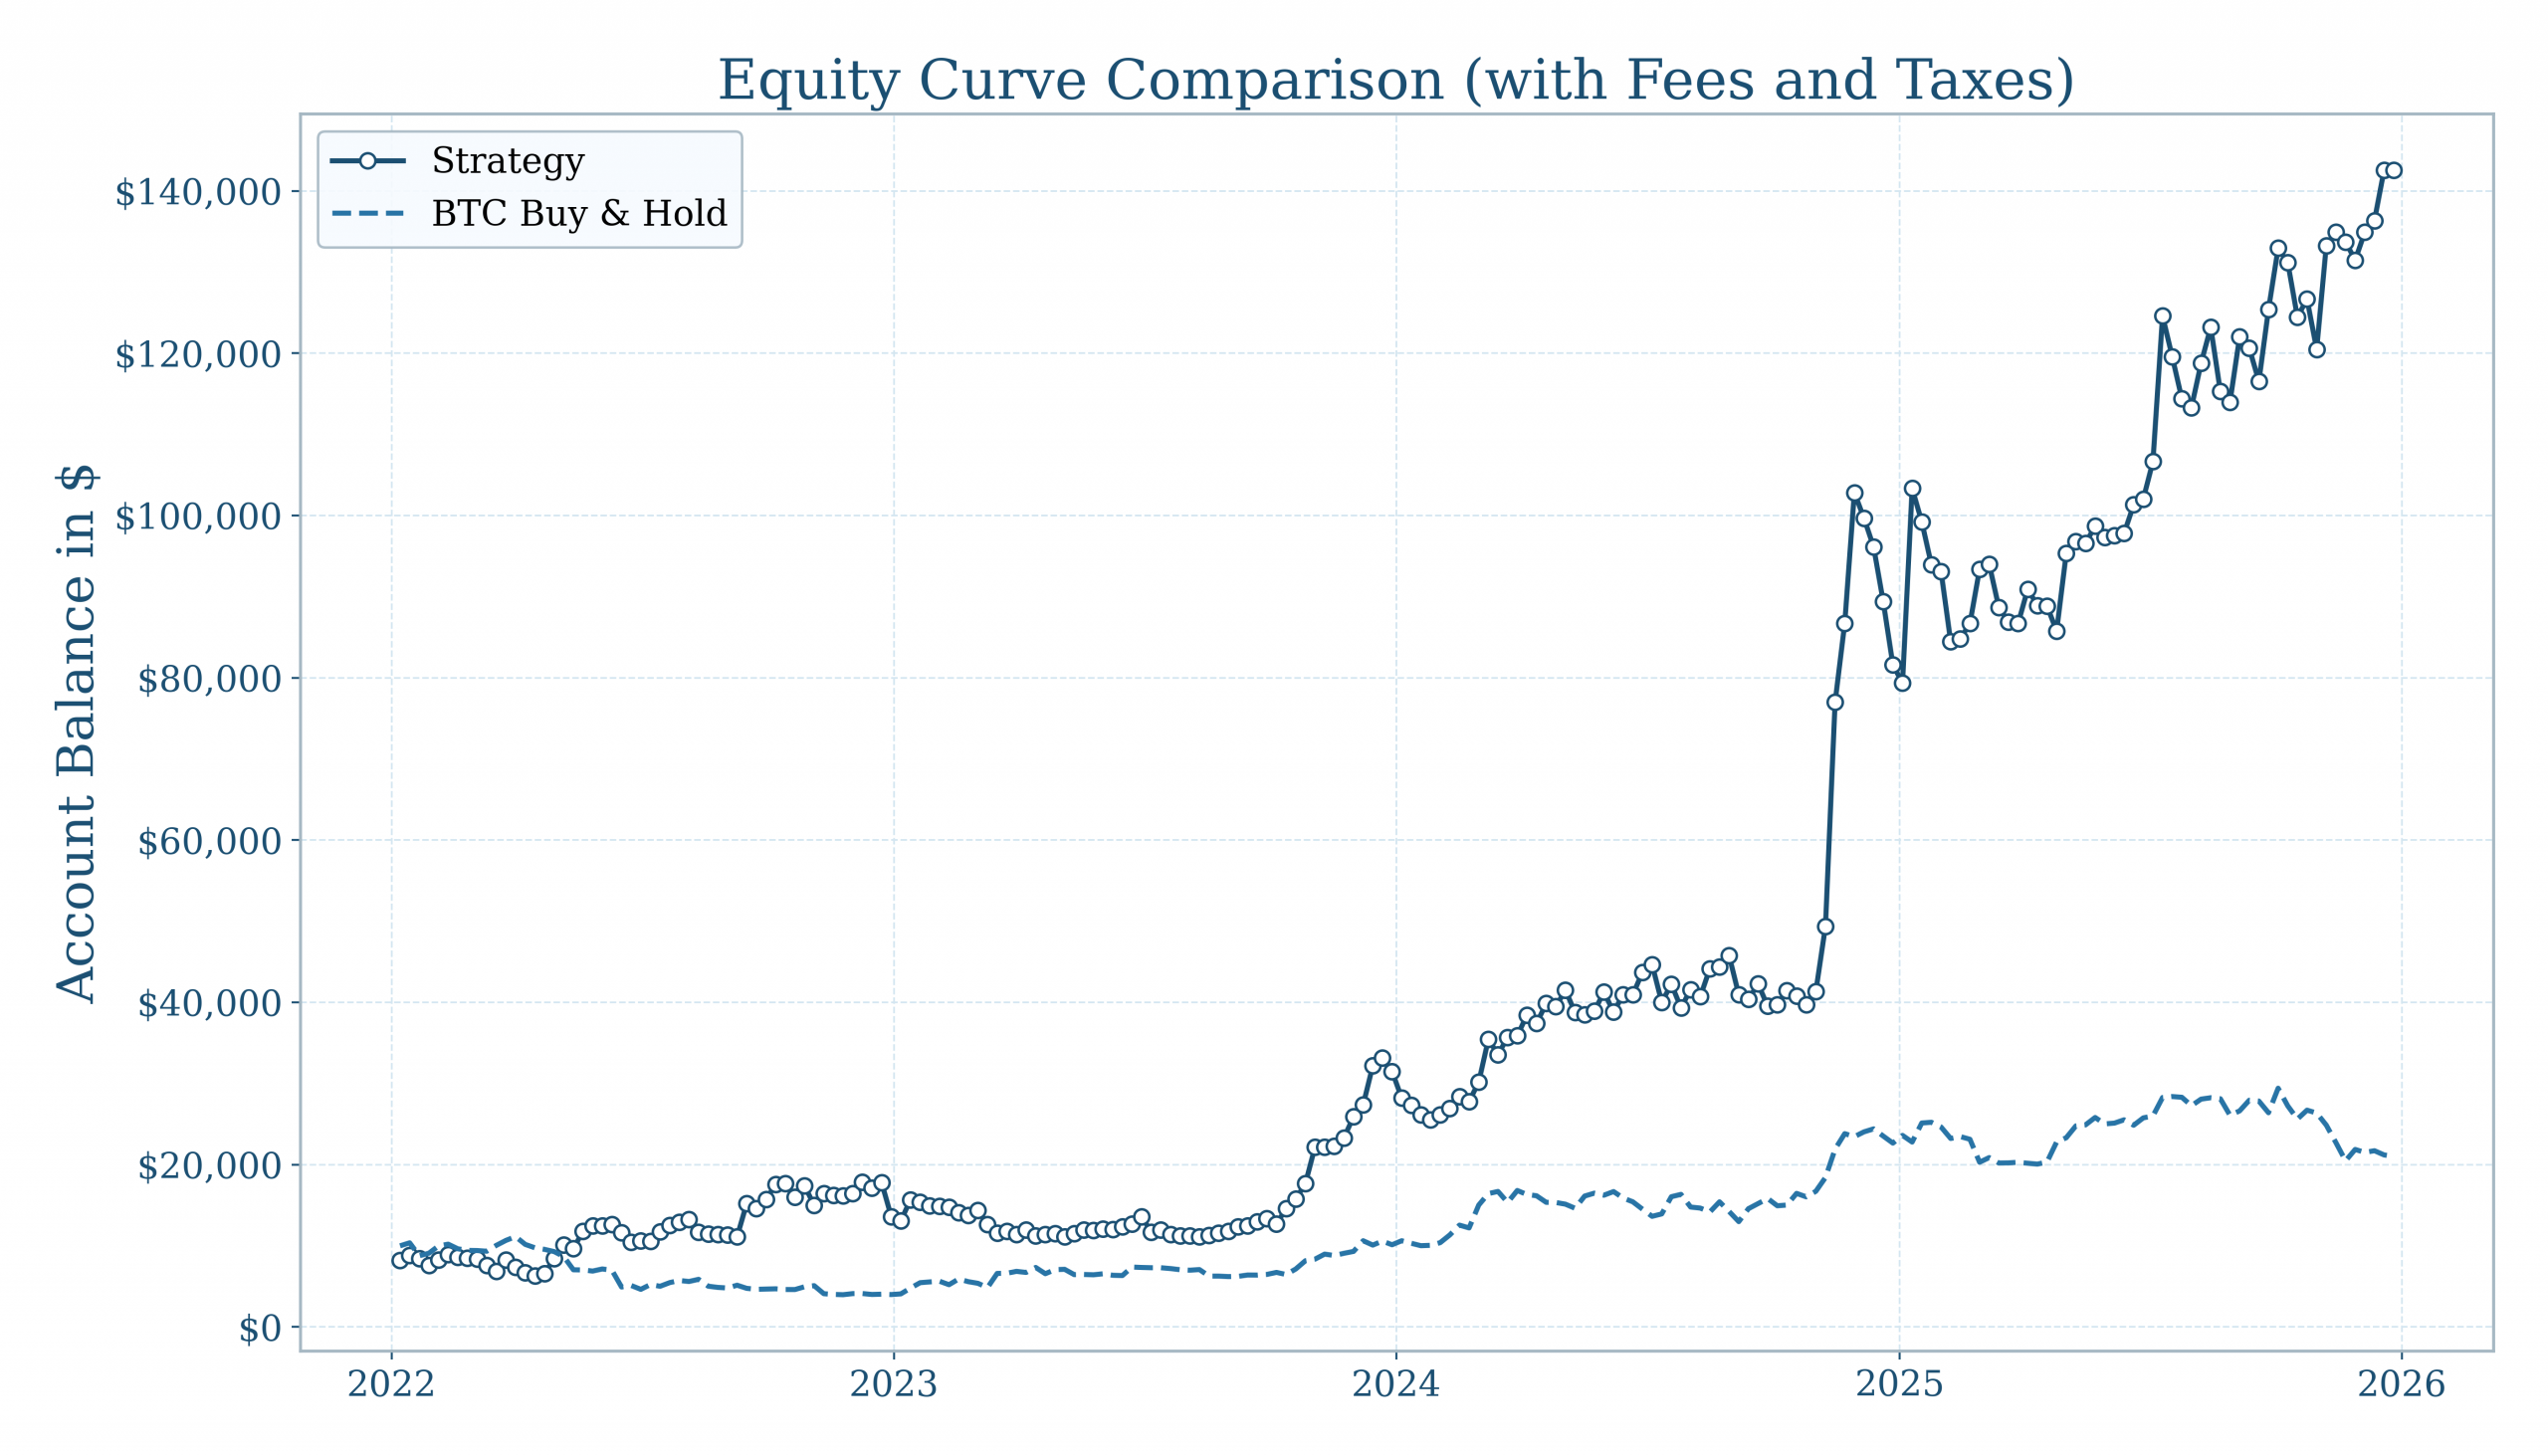
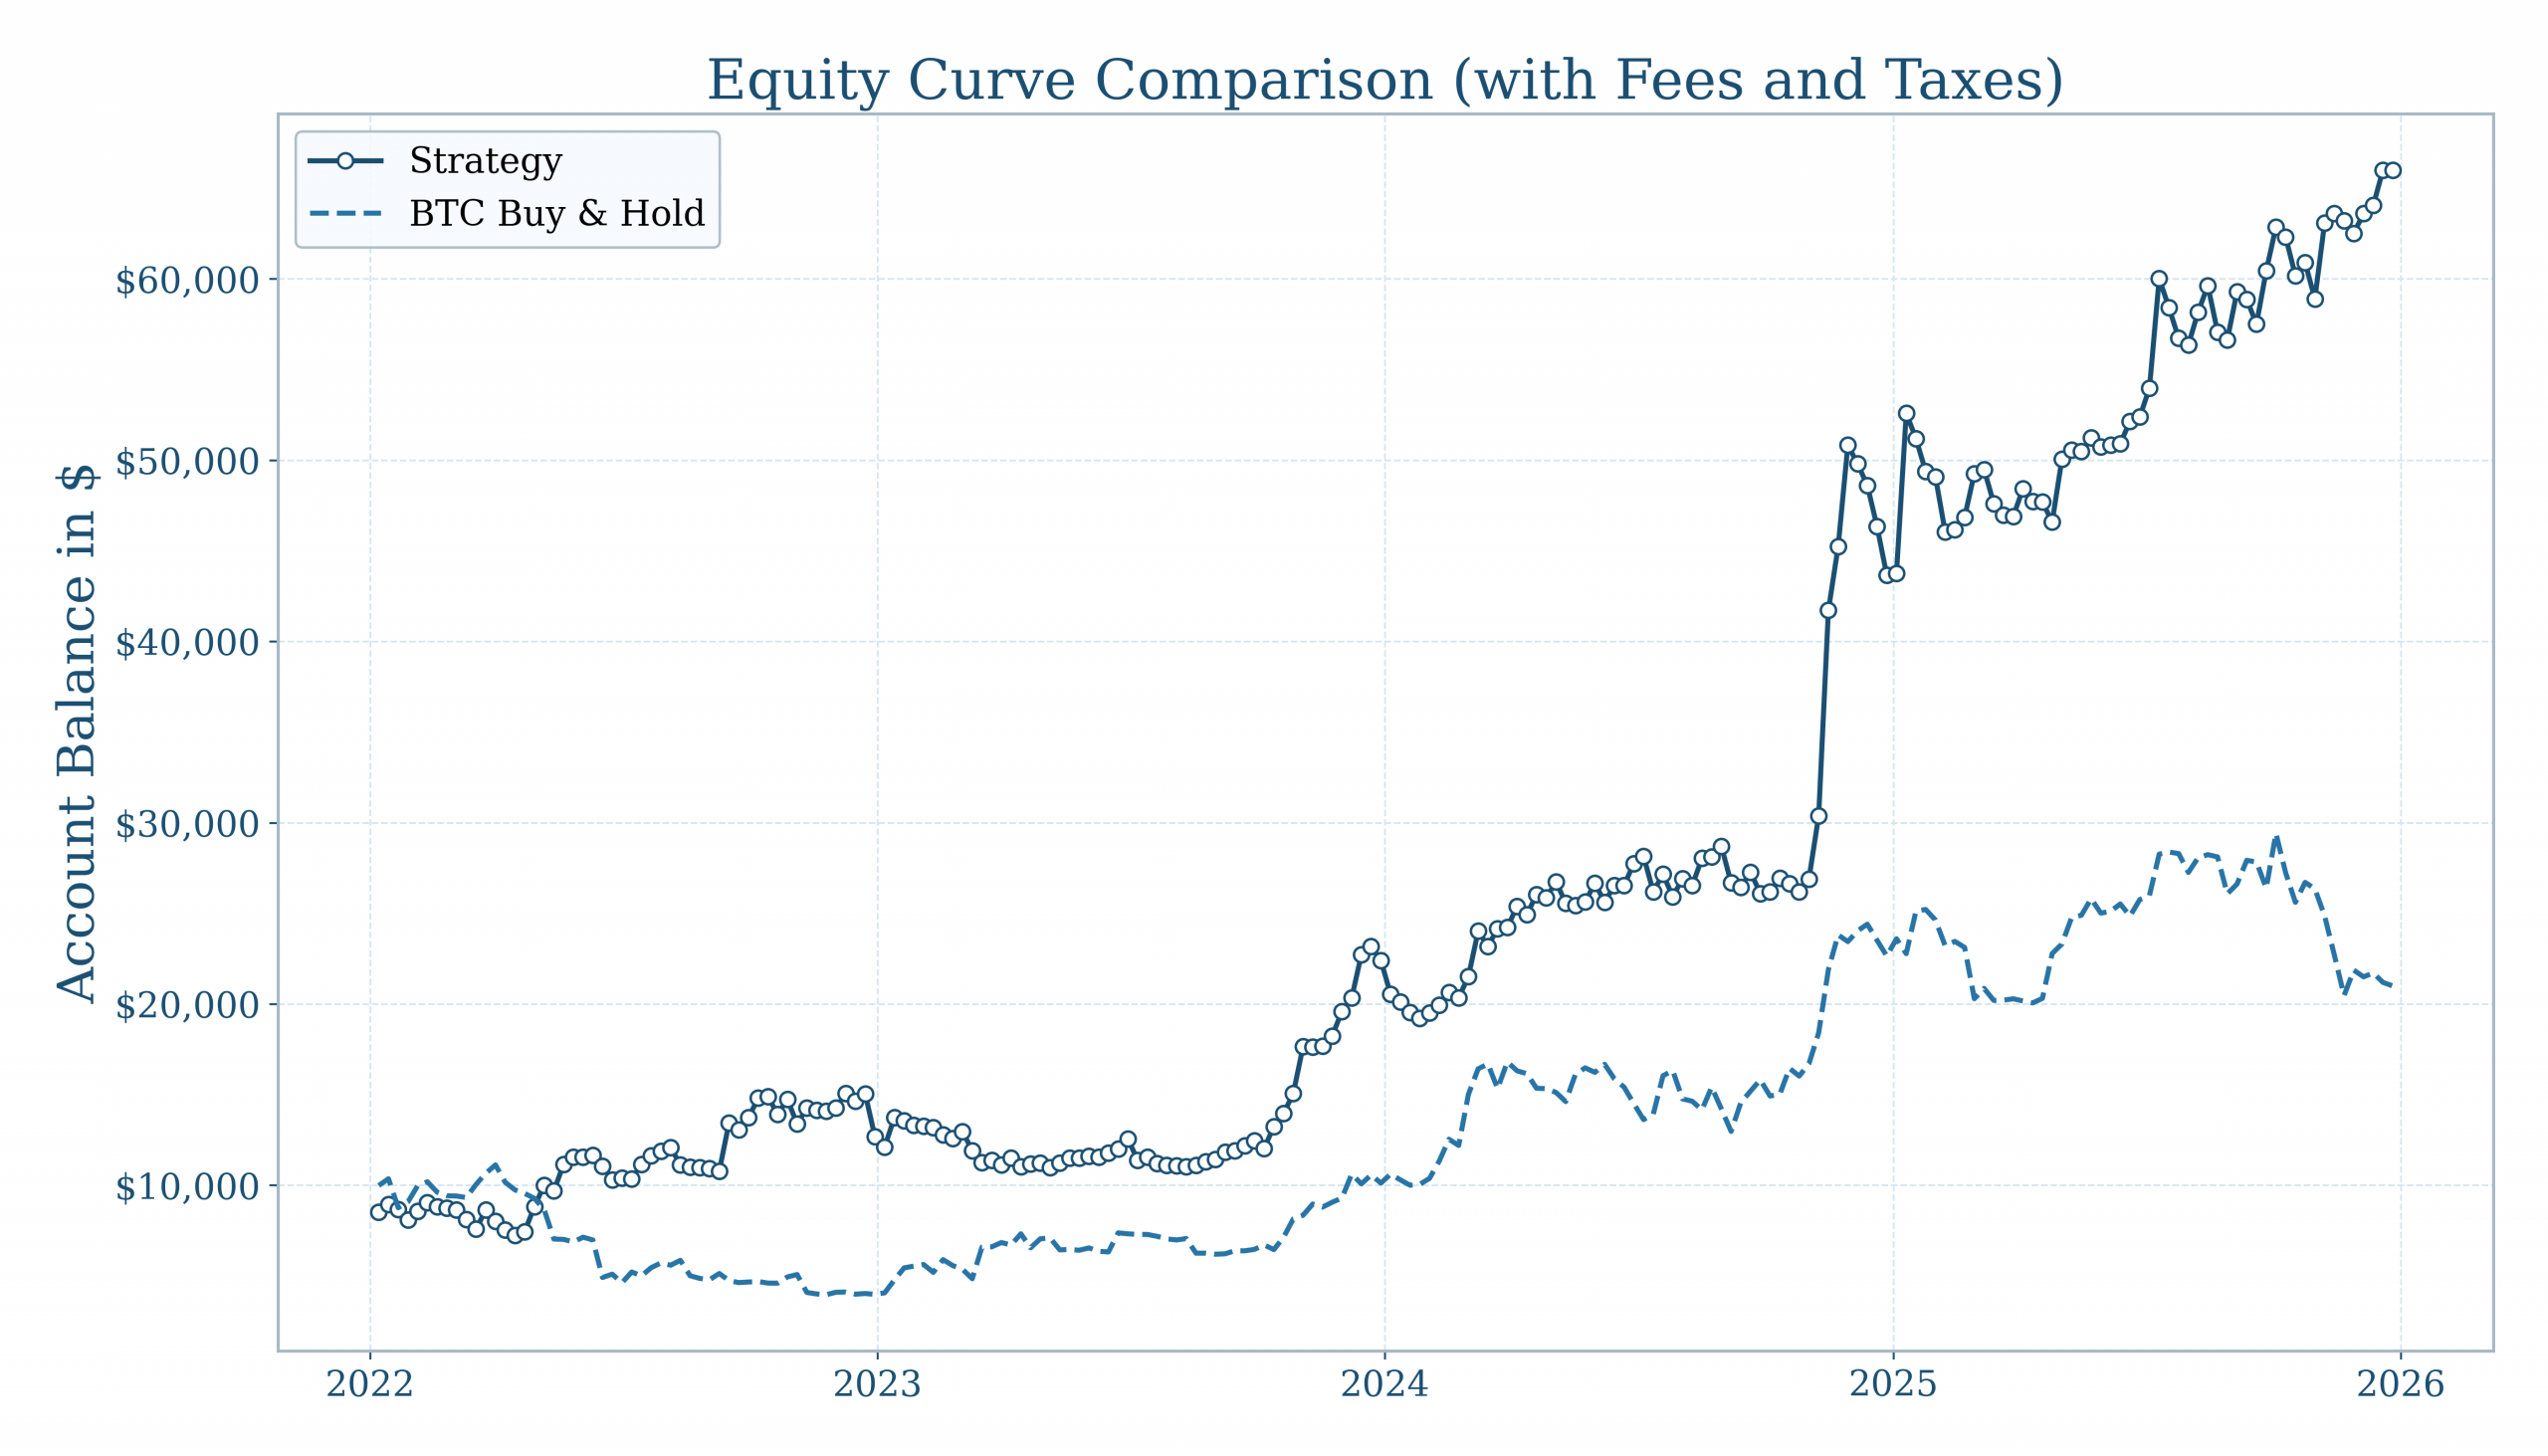
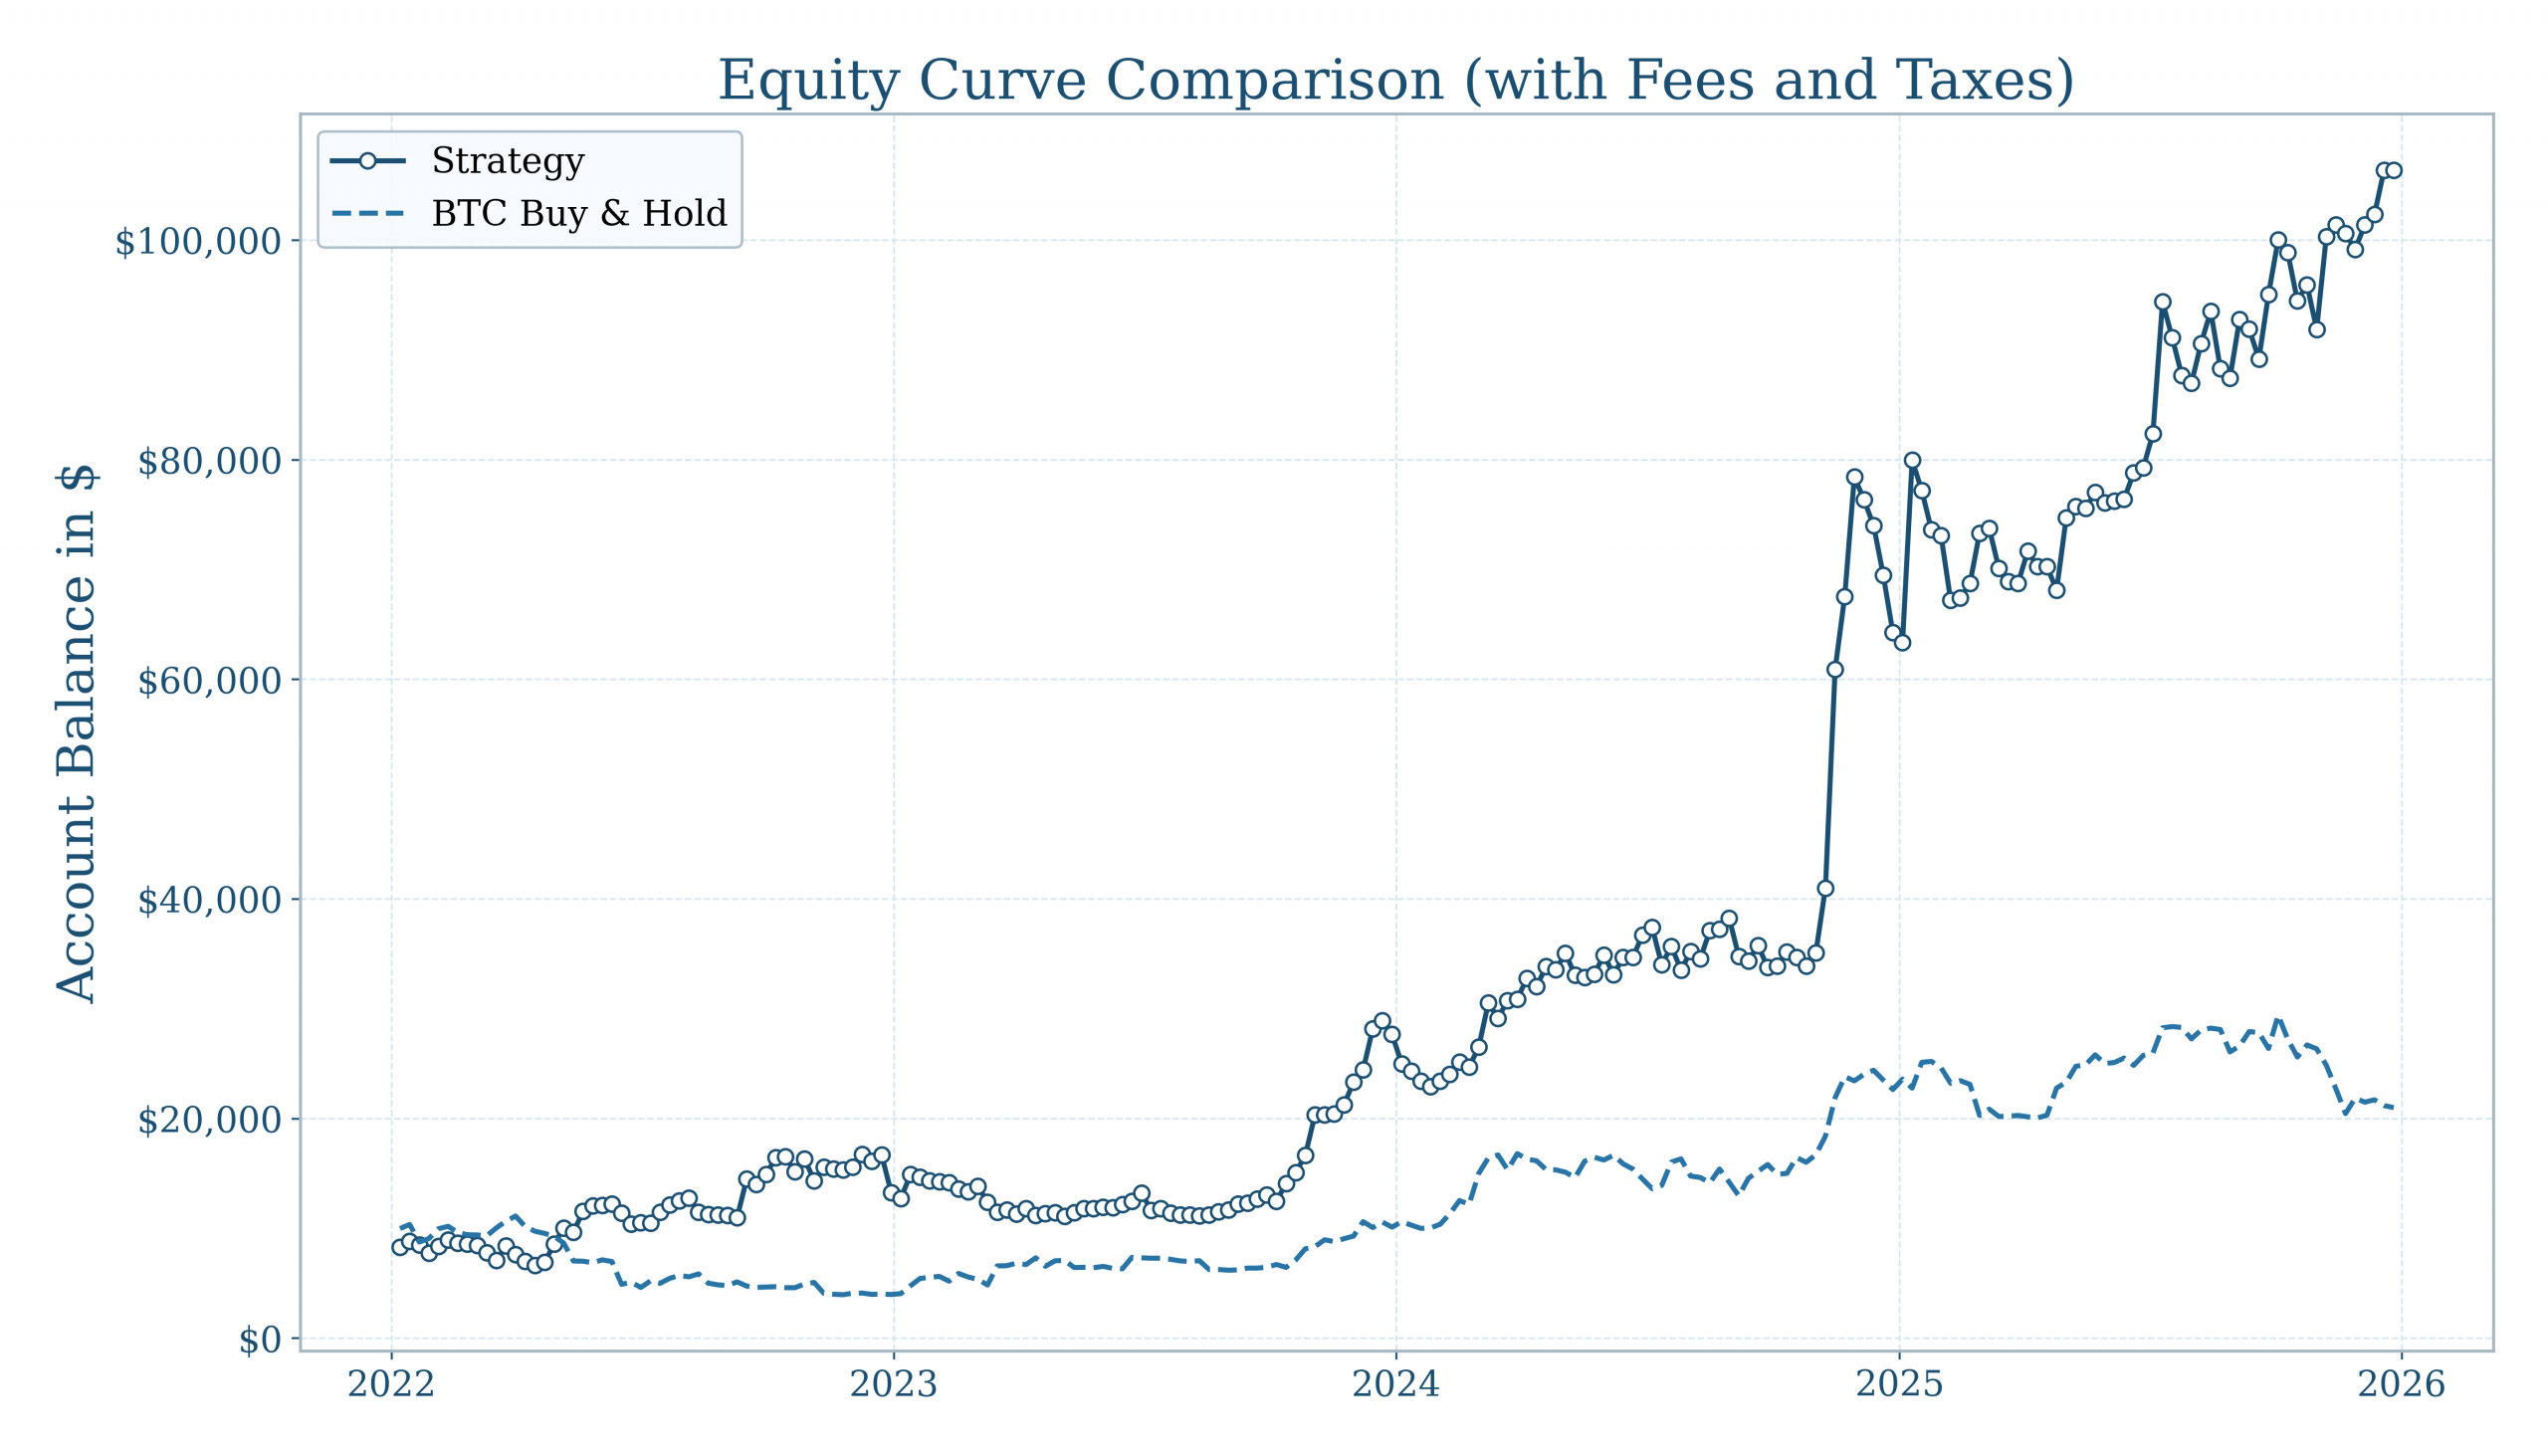
The following equity curve shows a comparison between the strategy equity curve and the BTC Buy & Hold equivalent from 2022 – 2026. The shown curve is for a 1x leverage and includes a default 0.1 % fee adjustment per trade. Taxes are included.
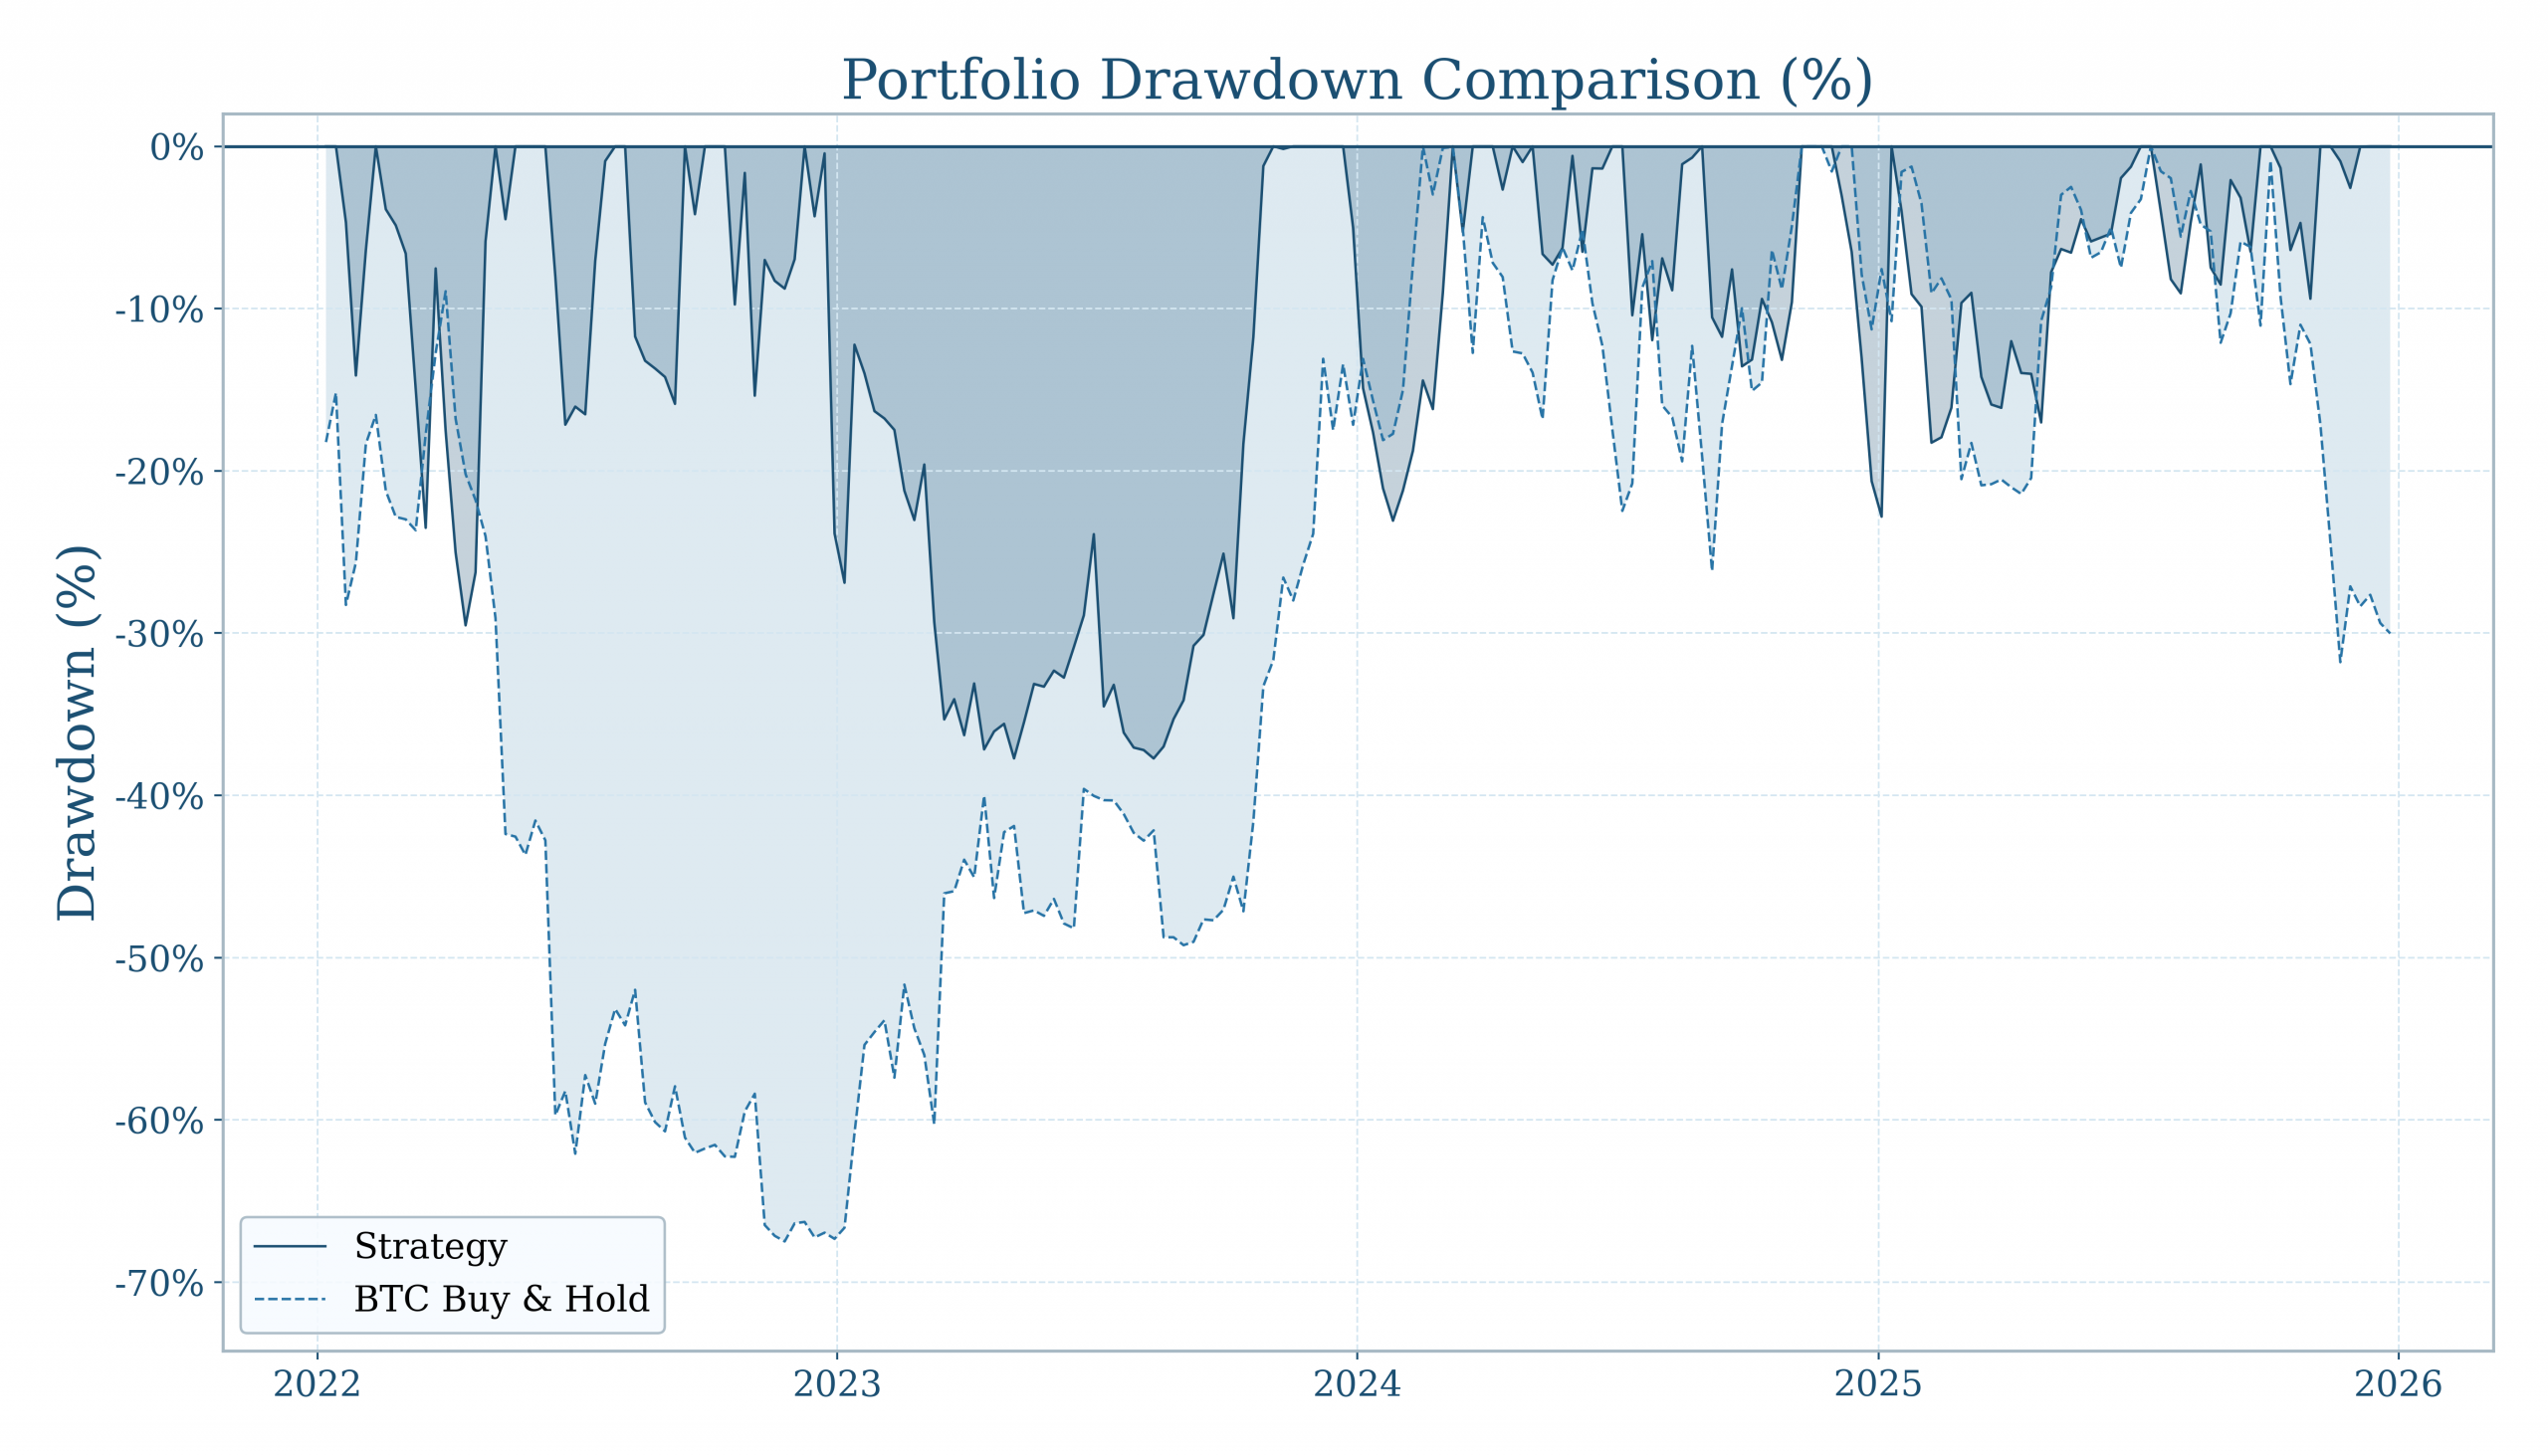
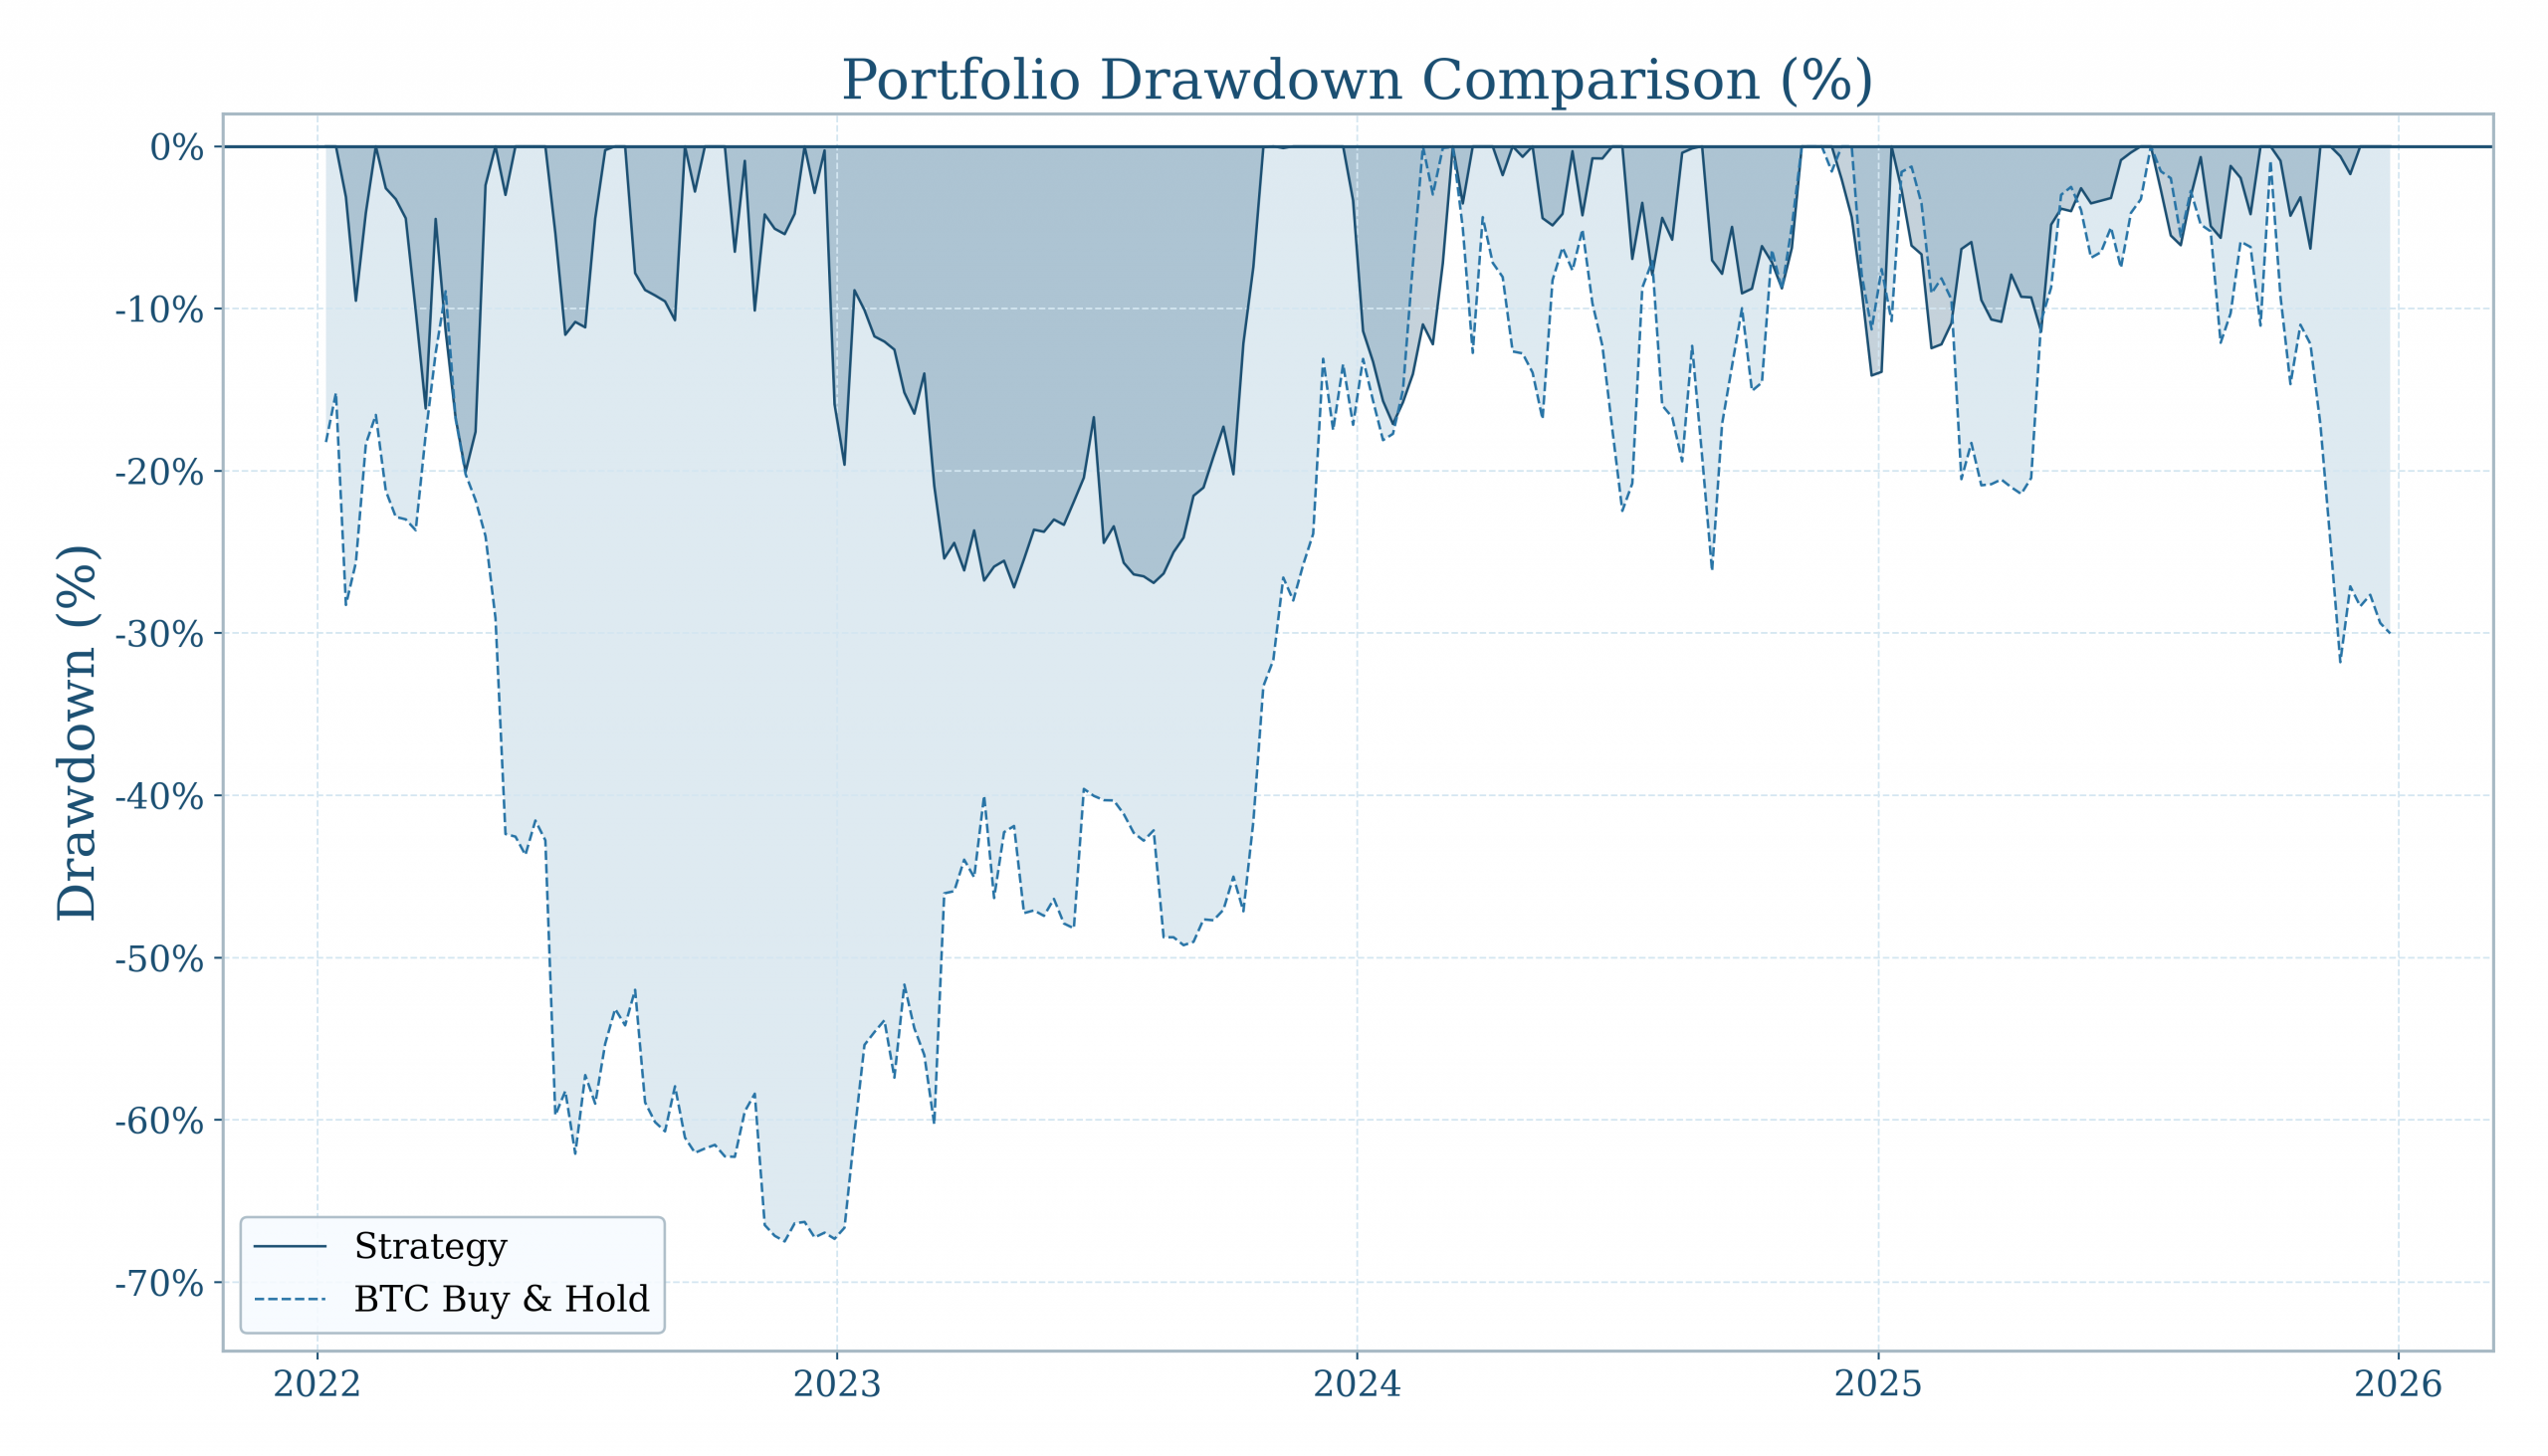
The following drawdown curve shows a comparison between the strategies‘ drawdown curve and the BTC Buy & Hold equivalent from 2022 – 2026. The shown curve is for a 1x leverage and includes a default 0.1 % fee adjustment per trade. Taxes are included.
1.3x Leverage – Equity and Drawdown Curve

1.5x Leverage – Equity and Drawdown Curve